Last updated: Jan 20, 2023

This week I’ve got some (mostly) good news regarding the “20% withholding from retirement accounts” challenge I mentioned in the previous post.
I also have a bit more stress testing analysis results of the Tax and Penalty Minimization (TPM) withdrawal method and the Traditional withdrawal method, this time looking at how each method does if expenses increase each year.
20% Withholding Problem
IRA Rollover Solution
When I first read about how the IRS generally requires a 20% withholding for any early withdrawals from retirement accounts, I thought, “ah crap, this is going to be such a pain to implement in my code.”
Then I thought, “Ugh, and this could easily hurt the portfolio performance as well, having to give the IRS that much money, which means even higher withdrawals to cover expenses.”
Very fortunately, when I researched it a bit further, it looks like that 20% withholding requirement is only required for the “400” accounts: 401(k), 403(b), and 457(b). It is NOT required for a traditional IRA! Whew!
So, you just have to rollover any funds you have in a 401(k) or 403(b) (or equivalent) to a Traditional IRA, and then you won’t have any issues with a required 20% withholding.
In essence, this policy simply discourages folks withdrawing from their accounts while still working – because in general you need to leave a company before you can rollover the retirement account.
Bad News for the 457(b)
However, I have now finally uncovered a significant disadvantage of the 457(b). While you won’t have to pay a 10% early withdrawal penalty from a 457(b), you WILL have to deal with this 20% withholding requirement. The official IRS documentation confirms. Poop!
While you won’t have this 20% withholding if you rollover the 457(b) account balance to a traditional IRA, that also means you’ll lose the incredible benefit of not facing 10% early withdrawal penalties. Bleh!
Thus, I strongly recommend, if at all possible, that you wait as late in the year as you can to withdraw from a 457(b) account. That way you’ll get that money back from the IRS ASAP the following spring (and also try to do your taxes ASAP).
Implementation Decision
When I first realized that rolling over to a traditional IRA solves the problem of required 20% withdrawals, I was super relieved – I don’t have to implement that logic, woohoo!
But when I discovered the 457(b) still has that required 20% withdrawal, I was once again faced with the task of implementing that withdrawal in my tools. Bleh.
So to get the actual amount of cash needed ($X), I’d need to withdraw $X/0.8. Thus after the 20% withdrawal, I’d be left with $X.
As that rolled around in my brain a while, I started to wonder if it was worth it though.
So if you get any excess withholdings back from the IRS the following spring, what’s the real penalty of this withholding? The loss of growth from that withholding over the time that the IRS has that money. So what might that be?
Let’s say you withdraw $25,900 (the married standard deduction) from your 457(b). 20% of that is $5,180. And let’s say you make that withdrawal an average of 4 months before filing your taxes. A 7% annual ROI for $5,180 over 4 months is just $120. Not a huge amount of money.
So in the end, I decided it was not worth the hassle of implementing this 20% withdrawal in either withdrawal method, for the following reasons:
- The penalty from loss of growth is pretty minor, and can be mitigated by making the withdrawal as late in the year as possible, and filing your return as soon as possible to get the money back. Thus I don’t think it will have a substantial impact on the final results.
- The tools will be simpler by not adding this complication, and thus easier to understand and maintain.
- Because I typically draw down on the 457(b) account first in the TPM method, in nearly all scenarios I’ve run the 457(b) gets spent down pretty quickly, usually within 5 to 10 years. So then it’s not even a concern anymore.
- The 457(b) is much less common than other traditional retirement accounts, so it’s not a concern for the vast majority of people.
Expense Increase Rates
When I first stress tested the TPM and Traditional methods, I looked at varying annual expenses and assumed investment ROI. But after I published that post, something that really interested me was how each method would do if expenses increased over time (relative to current day dollars), instead of simply remaining the same for all years (again in current day dollars).
Betty’s Filing Status: Single
As always, I’ll employ Betty for the single-filer scenario.
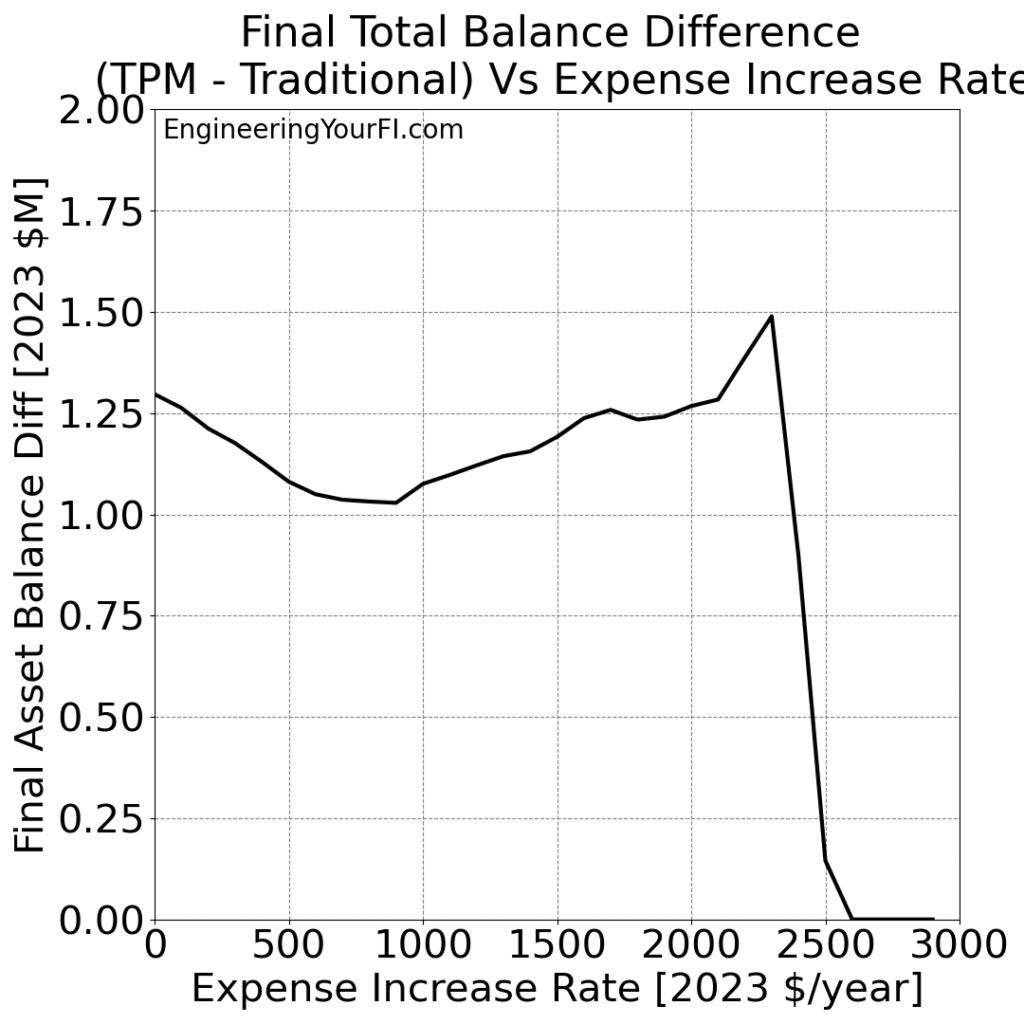
Let’s plot Betty’s final total balance over the 52 year simulation for a range of expense increase rates, from $0K/year (expenses don’t change, in 2023 dollars) to $3K/year (expenses increase by $3K each year, in 2023 dollars):
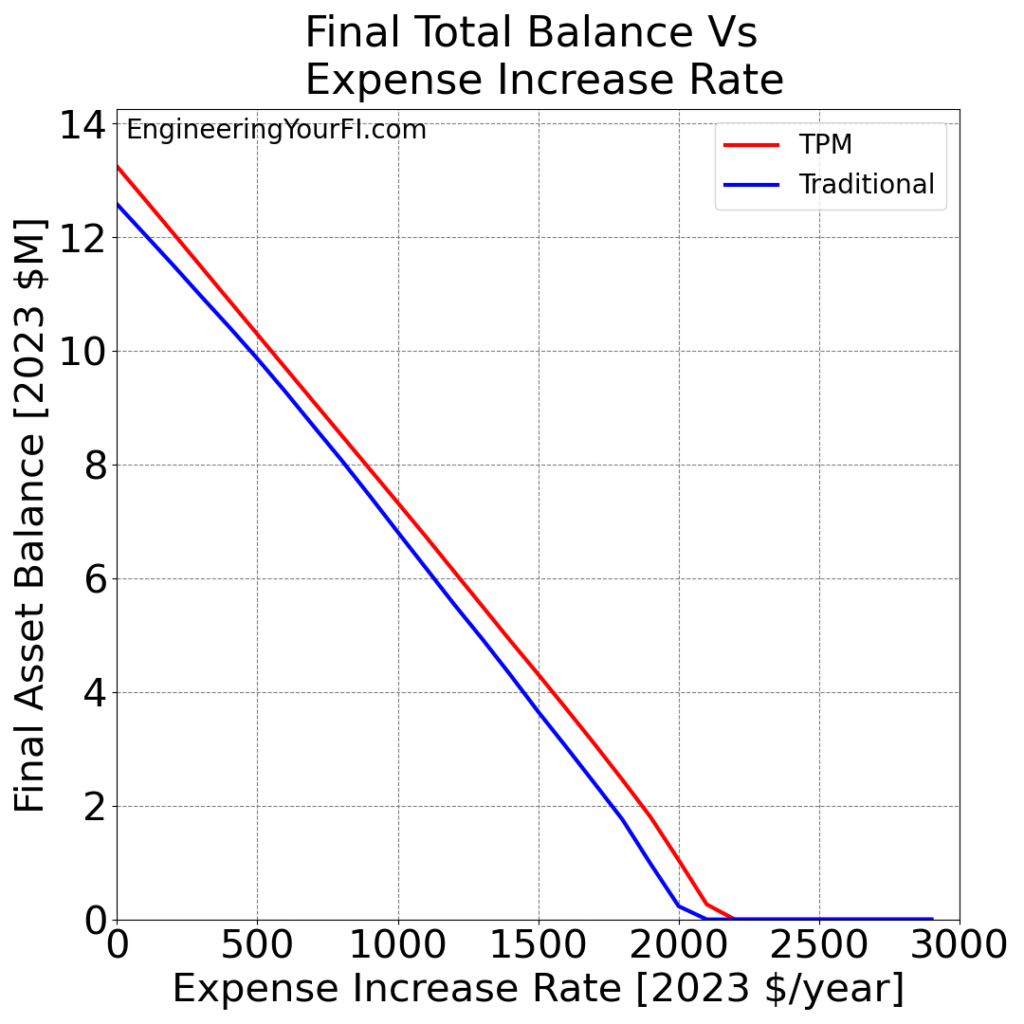
As usual, the TPM method consistently does much better than the traditional method, and Betty doesn’t run out of money with either method unless she increases her expenses every year by at least $2K.
And just like in the previous stress testing post, I’m surprised how linear these results are. The difference between the TPM and Traditional methods is definitely not linear though:
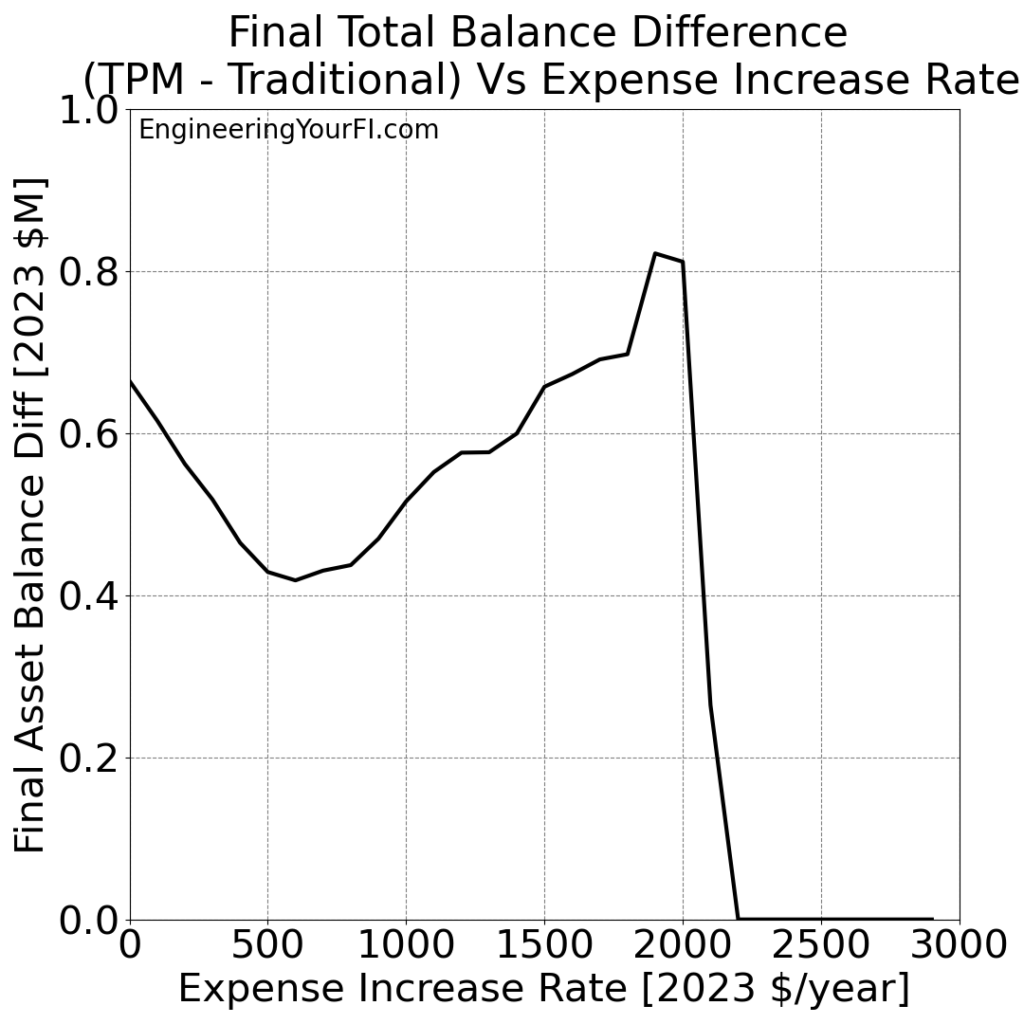
Unlike in the previous stress testing post, we find the TPM advantage over the Traditional method varies in unpredictable ways, dipping down and then back up to peak at around $2K/year.
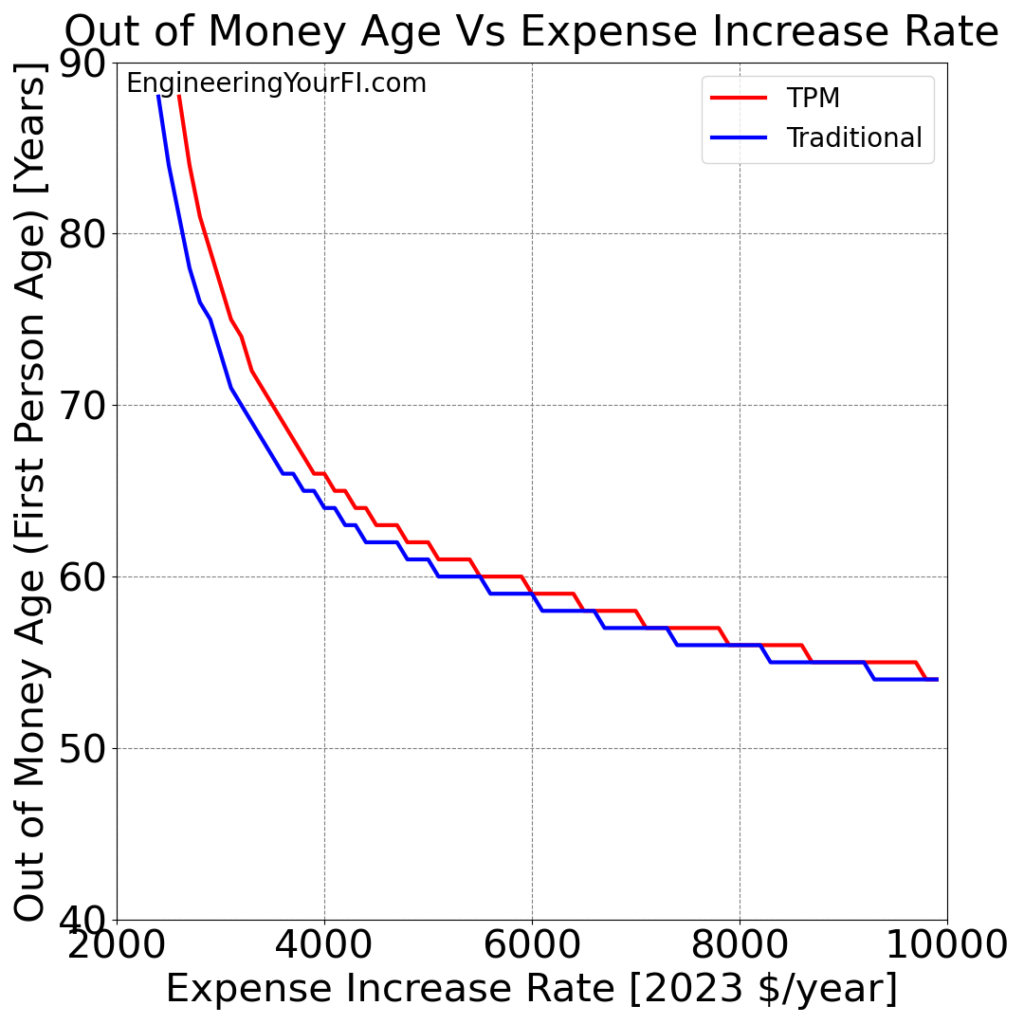
Now let’s take a look at higher expense increase rates, to see what age Betty is when each method runs out of money:
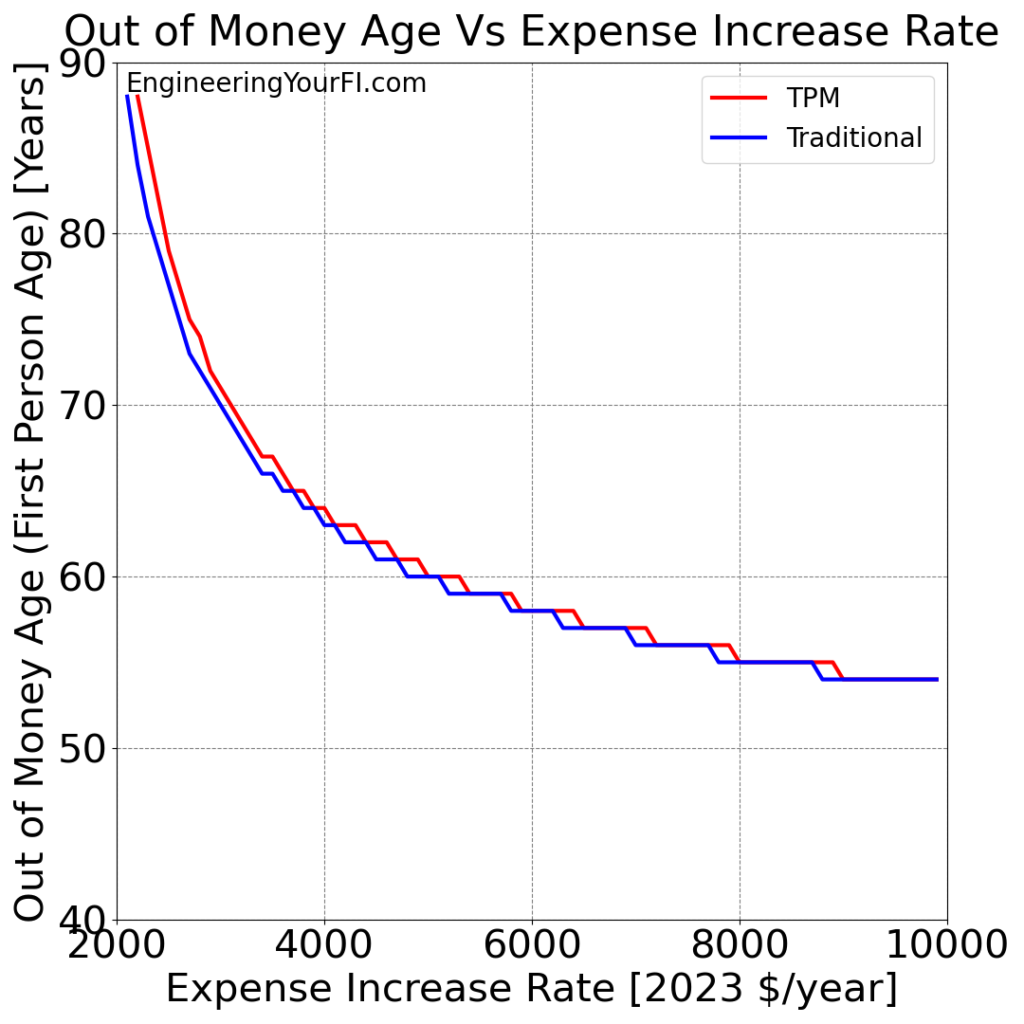
As usual the TPM results are the same or higher than the traditional method results. What’s interesting is how the plots appear to level out with higher and higher expense rates – I’m guessing because there are fewer and fewer years for the expense levels to grow. And as usual, the TPM and Traditional method results converge over time.
Bill and Barbara’s Filing Status: Married Filing Jointly
As usual, we’ll employ the married couple Bill and Barbara in our “married filing jointly” scenario.
Plotting their final total balance over the 52 year simulation for a range of expense increase rates, from $0K/year to $3K/year:
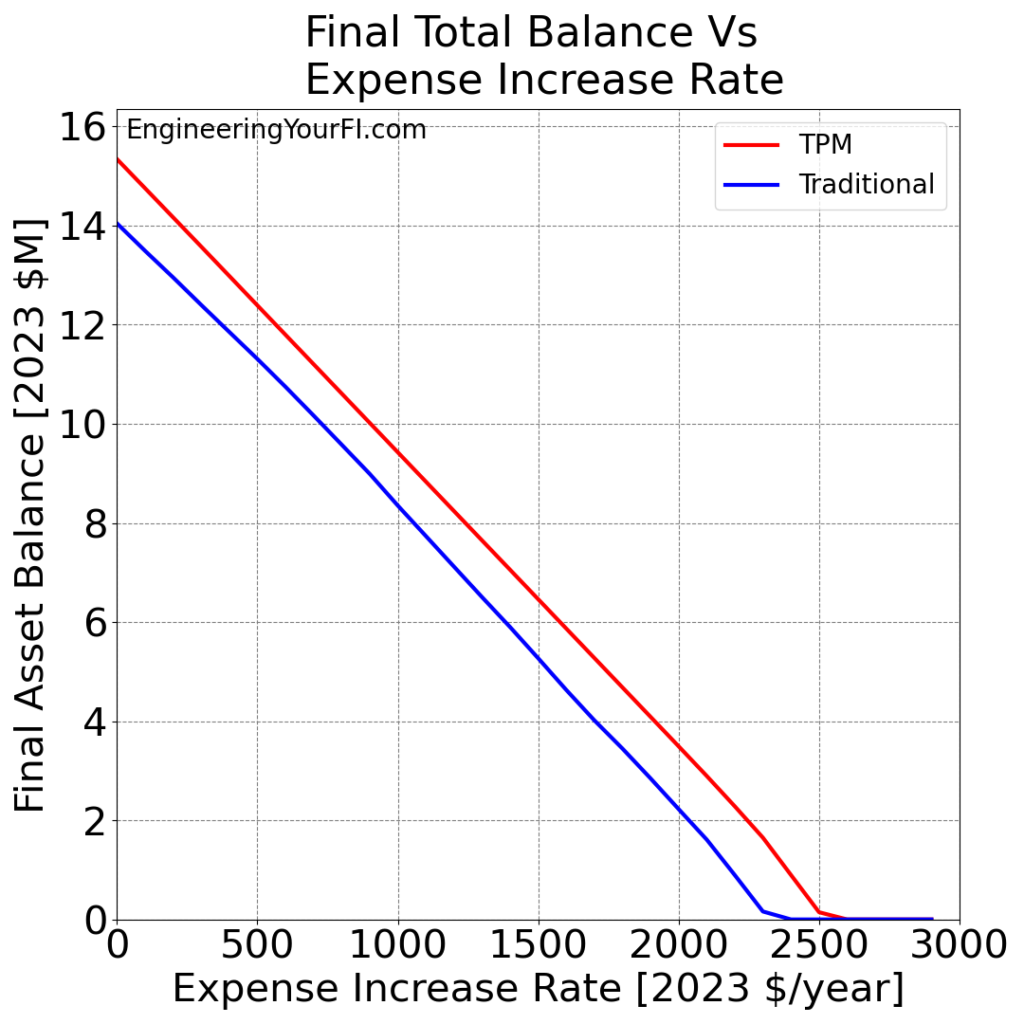
Wow, these plots are even more straight and linear than Betty’s. And thus the difference plot of the two methods is also a bit flatter:
Finally, if we look at higher expense increase rates, to see what age Bill (the older of the two) is when each method runs out of money:
We get a similar result to Betty’s above: the TPM results are the same or higher than the traditional method results, both plots appear to level out with higher and higher expense rates, and the TPM and Traditional method results converge over time.
Other Possible Expense Variations
There are a couple other possible ways to vary expenses that come to mind: percentage increases each year, and expense decreases.
If we were to increase expenses by a particular percentage each year, then we’d face exponential growth in expenses over time. However, I’m concerned that could lead to incredibly high (and thus totally unrealistic) expense levels for all but the smallest percentages. So I’m not sure how useful that would be. But I might still do that someday – let me know if you’re interested in seeing that.
We could also easily look at expense decreases each year, and I did initially consider doing that in this analysis (e.g., having expense rates ranging from -$3K/year to +$3K/year, instead of $0/year to +$3K/year).
However, that would quickly lead to $0 expenses (obviously not realistic) and then negative expenses (VERY unrealistic) in a 52 year simulation. So I decided to be conservative in this analysis and only look at expense increases.
Plus, in general if you’re somehow decreasing your expenses each year, starting from traditional FI, then you’re probably golden anyways and won’t have any worries of running out of money.
What’s Next?
As I mentioned in the previous post, and in the Future Work section of the stress testing initial results post, I’d like to build a new capability in the TPM method that could further increase its performance over the traditional method (or perhaps not have much impact, TBD).
Right now, if the TPM reaches the point of employing the numerical integration subroutine to obtain the needed cash with minimal taxes/penalties, it starts from the current pre-tax and post-tax withdrawal values to find the lowest tax/penalty path forward.
But, I’d like to see if I can try reducing pre-tax withdrawals such that we can sell more post-tax lots and stay within the 0% LT cap gains brackets. That could potentially provide more cash with zero additional taxes, since LT cap gains are a fraction of the cash you would receive when selling, vs 100% of the pre-tax account withdrawals counting as standard income.
I expect I’ll need to employ a numerical integration method for this idea, due to the considerable number of factors involved.
Once I get that new capability implemented and tested, then I need to update the FIRE Withdrawal Strategy Algorithms page to show the latest formulation I have for the TPM (and Traditional) methods. And perhaps either modify that page or create a new page/post that makes it as easy as possible to understand and execute the TPM method.
As always, if you have ideas for future content, let me know!