Last Updated: February 8, 2022
Social security income, which the Social Security Administration refers to as retirement insurance benefits (RIB), is a bit tricky when it comes to taxes. Though “a bit” might be an understatement for many folks.
Now you may be wondering why I’m talking about social security income on a blog about FIRE. Isn’t social security going to be gone by the time any of today’s early retirees reach their 60’s?
Well, no, it’s not going to be gone. Yes, Congress might have to act (and I’m pretty sure they will, given the rage they will face from constituents if they don’t), and we might see a bit lower benefits and a later retirement age (since the social security program was designed when lifespans were much shorter), but it won’t go away.
And as described in my previous post, your RIB can be a pretty dang important part of your income later in life, and thus it’s vital to account for it.
Want an estimate of how much RIB you can expect to get? Create an account at the social security administration site, where it will show if you have enough credits to receive RIB, as well as how much it predicts you’ll receive at a few different standard retirement ages (which you can adjust to specify a much lower or zero income after the current year, if you’re FIREing this year).
Computing Taxable RIB
Also in my previous post I described a method for withdrawing funds after achieving FIRE that I call the Tax and Penalty Minimization (TPM) method, which involves targeting specific taxable income levels to minimize taxes and penalties.
But, to target a specific taxable income with RIB, you’ve gotta know how much of your RIB is taxable.
And guess what? To no one’s surprise, the IRS method for computing the amount of your RIB that is taxable is not super simple.
I searched extensively online for a straightforward algorithm I could use, but all I could find was hand waving about 50% and 85% brackets, and about how the maximum amount of your RIB that is taxable is 85%. In the end I had to derive it myself from the relevant IRS worksheet.
Below is my attempt to create what I could not find online – a description of the algorithm that is not in the language of IRS worksheets.
Algorithm: Computing Taxable SS Income
Turns out that taxable RIB is a function of three things: your tax filing status (single, married filing jointly, etc.), your total non-RIB (all other standard income plus all long term cap gains), and your total RIB (so combined RIB for married filing jointly).
Note: the below algorithm assumes that lines 4, 5, 7 of the IRS worksheet are zero, as they are relatively uncommon factors. But if they apply to you, make sure you account for them.
Filing Status Values
To start, a couple of factors are specified based on your filing status.
If you’re single, head of household, qualifying widow(er), or married filing separately, a value we’ll call “Minimum Income” (MI) is specified as $25K, and a value we’ll call “Delta” (which is the size of the 50% taxable bracket) is $9K.
If you’re married filing jointly, MI is $32K and Delta is $12K.
Minimum Income (MI)
If your total non-RIB plus half of your RIB (Non-RIB + 0.5*RIB) does not reach this MI value, then none of your RIB is taxable and you can stop the algorithm.
Over MI, but Still Within 50% Bracket
If Non-RIB + 0.5*RIB DOES exceed the MI value, then we must determine if it stays within the 50% bracket.
If the amount that Non-RIB + 0.5*RIB exceeds MI (Non-RIB + 0.5*RIB – MI) is less than the 50% bracket length Delta, then OverDelta is zero – easy! If not, then go to the next section.
Then we must determine how much of the income inside that 50% bracket is taxable, which we’ll call Theta. Theta is set to be the smaller of these two quantities: (Non-RIB + 0.5*RIB – MI) / 2, or 0.5*RIB.
So if Non-RIB – MI is over 0.5*RIB, then the smaller quantity is 0.5*RIB. If not, then (Non-RIB + 0.5*RIB – MI) / 2 is the smaller quantity. So it depends on how much Non-RIB you’re bringing in and how much your RIB is.
Over MI, and Beyond 50% Bracket
Now if Non-RIB + 0.5*RIB exceeds both the MI value AND the top of the 50% bracket (MI + Delta), ignore the previous section and do the following.
First compute the amount that we go over the 50% bracket: OverDelta = RIB*0.5 + Non-RIB – MI – Delta.
Then we must determine how much of the income inside the 50% bracket is taxable, which we’ll call Theta. Theta is set to be the smaller of these two quantities: 0.5*Delta or 0.5*RIB.
So if your RIB is pretty small and thus half your RIB is less than half the 50% bracket window, you’ll use that. If your RIB is more sizeable and thus half the 50% bracket window is greater than half your RIB, the amount of income in that bracket you’ll pay is limited to just 50% of that bracket.
Computing Final Taxable RIB
The final step of computing your taxable RIB consists of selecting the smaller of two values:
- 0.85*RIB (85% of your RIB)
- Theta + 0.85*OverDelta (the taxable amount in 50% bracket plus 85% of the amount over the 50% tax bracket)
Thus the maximum percentage of your RIB that is taxable is 85%.
Verification
After deriving/consolidating the above algorithm, I created a Python tool that allows you to compute how much of your RIB is taxable.
To verify the above algorithm always produces the same answer that the IRS worksheet produces, I created two different functions: one that sticks as closely to the IRS worksheet as possible, and another that uses the above consolidated logic.
I ran each function with an array of RIB values ($1K increments from $0 to $50K), and for each RIB value I ran with an array of non-RIB values ($100 increments from $0 to $100K).
Every single one of those 50*1000 = 50K values were identical for both methods. Thus I feel confident in the above consolidated logic for computing the final taxable RIB, but if you can find a scenario where the above algorithm doesn’t match the IRS worksheet, please let me know.
Plots
When I first reviewed and consolidated the algorithm for computing the taxable RIB, I still couldn’t wrap my head around it very well. So to build up some intuition, I decided to plot the taxable RIB over a range of both non-RIB and RIB values.
Max RIB
Before plotting though, I thought I’d check quickly to see if there is any kind of maximum amount of RIB you can receive – so my plots have reasonable bounds. And it turns out, YES, there is! Which in hindsight doesn’t surprise me, because there’s also a maximum amount of income you can be taxed on for social security.
Turns out the maximum monthly RIB anyone can receive in 2022 is $4,194 – which would involve earning at or over that maximum taxable amount for social security ($147,000 in 2022) for all 35 of your top earning years (adjusted for inflation) – not an easy feat, but it can be done by a select few. It also involves waiting until age 70 to collect benefits – again, unlikely (and perhaps not the smartest move in terms of market returns), but it can be done.
So a maximum monthly RIB of $4,194, that’s a yearly RIB of $50,328. And if you’re married and you both somehow pulled off getting the max, then double that to $100,656.
Thus the “Married” filing status plots below use a maximum of $100K RIB, and all other status plots use a maximum of $50K RIB.
Filing Status: Married Filing Jointly
First up, let’s look at plots for the Married Filing Jointly status.
If we compute the taxable RIB for non-RIB values in $100 increments ranging from $0 to $100K, and we do that for five different RIB values ($20K, $40K, $60K, $80K, and $100K), we can see five plotted lines corresponding to those five different RIB values:
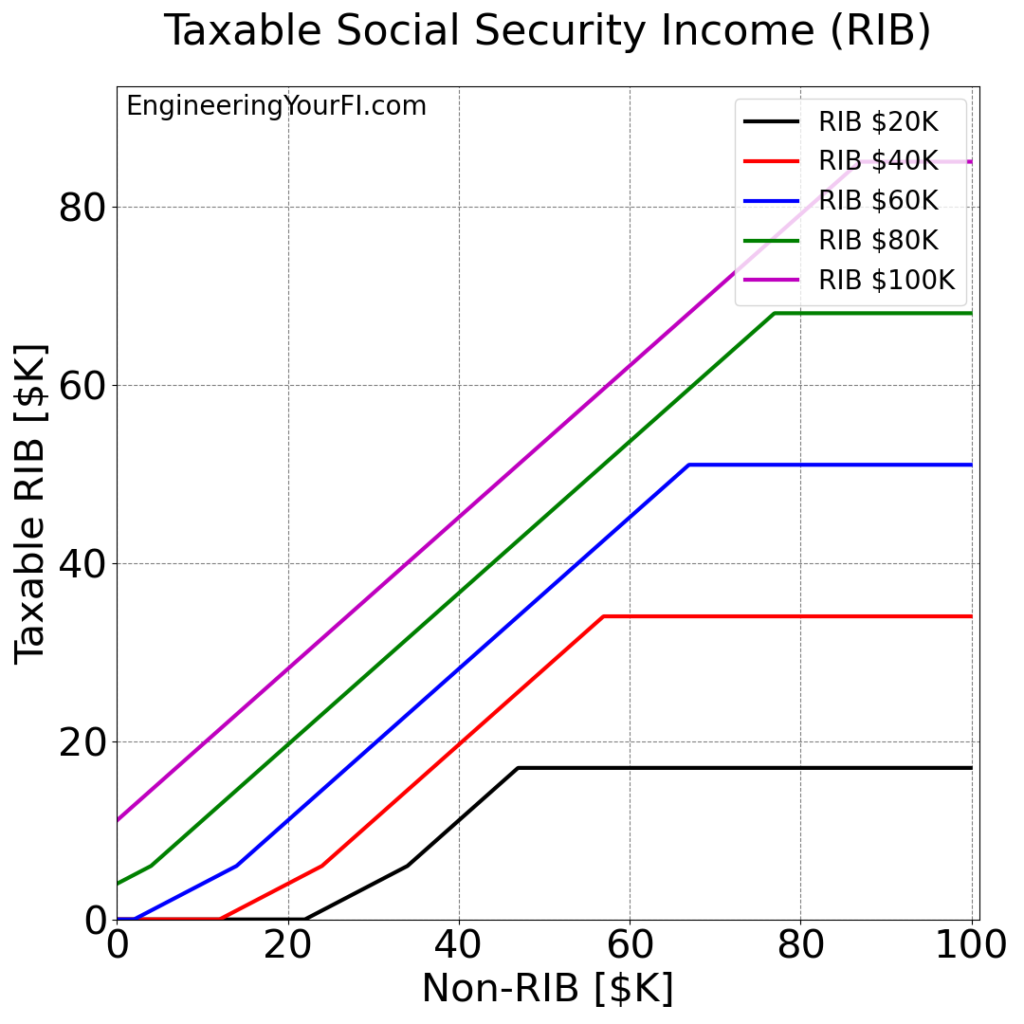
The first thing that jumps out to me, besides the cool stair-step look of this figure, is how each line hits a “plateau” that corresponds to 85% of the RIB value. So the RIB $20K plot levels off at $17K, the RIB $40K plot levels off at $34K, etc.
You can also see that for higher RIB values, it takes more non-RIB to hit that max 85% taxable RIB. E.g. if you have $20K in RIB, you’ll hit the max around $47K non-RIB; but if you have $60K in RIB, you won’t hit the max until non-RIB reaches about $65K.
Thus looking at this plot, you can get a sense of how much non-RIB results in the 85% max rate for a particular RIB. So if your RIB is about $30K, you’d need to have non-RIB in the ballpark of $50K to pay taxes on 85% of your RIB. And if you have non-RIB in the ballpark of $20K or less, then most or all of your RIB will not be taxable.
Across all RIB values, the more non-RIB you have, the more likely some of your RIB will be taxable, and the more likely you are to have the full 85% of your RIB taxable. This fact implies that if you have the ability to reduce your income somehow (e.g. via retirement account contributions or keeping more money in your business vs paid out as salary), you might be able to also reduce the amount of RIB that is taxable (and thus your total tax bill).
Finally, if you look closely you can see three distinct bends in the plots:
- the point where there is enough non-RIB to have some taxable RIB
- the point where the taxable RIB transitions from exclusively inside the 50% bracket to also include the 85% bracket
- the point where you max out at 85% of RIB
The transition bend point from the 50% bracket to the 85% bracket happens at a different non-RIB for each RIB plot considered, but the taxable RIB (vertical axis value) for each bend point is the same, due to the constants used for all scenarios (see section “Filing Status Values” above). E.g. the Married Filing Jointly 50% bracket width is $12K, so the bend point for all plots is 0.5*$12K = $6K.
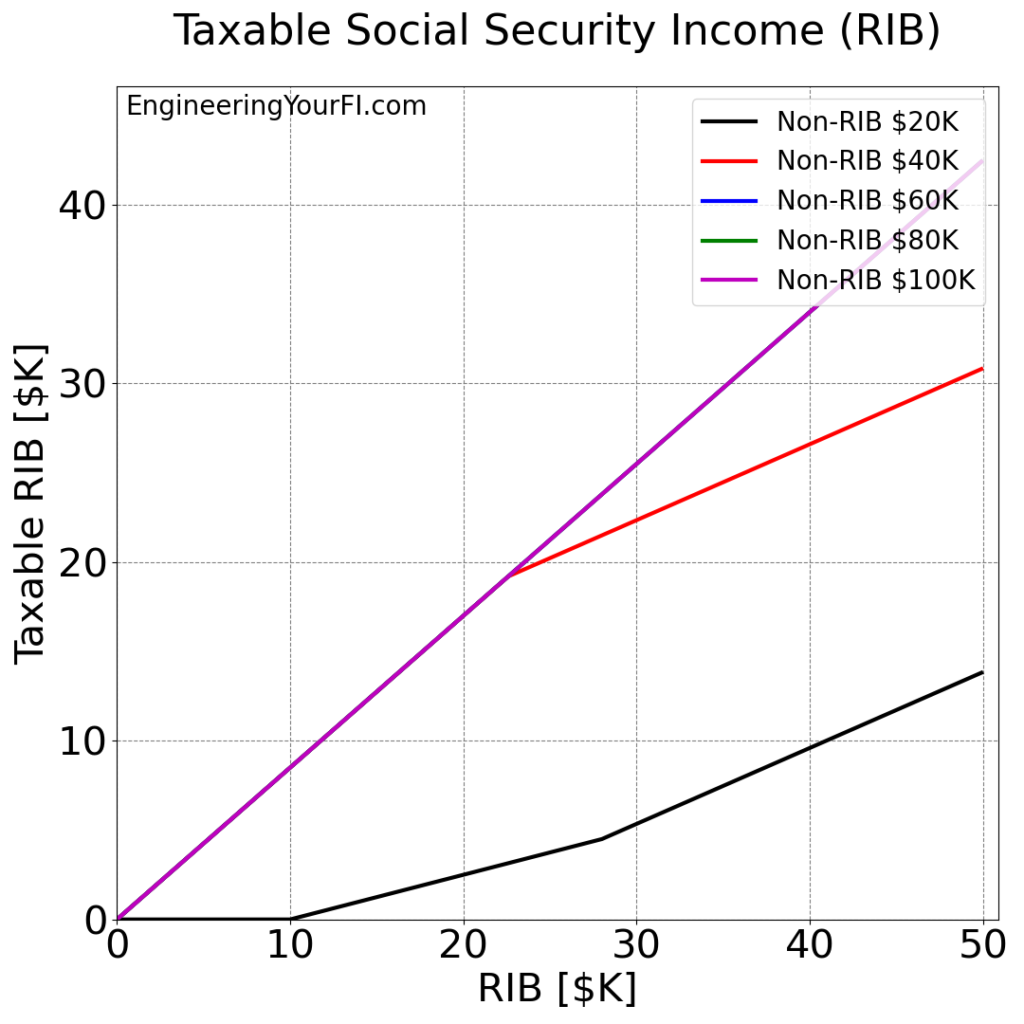
Now let’s look at a plot that’s roughly the inverse of the above plot: compute the taxable RIB for RIB values (instead of non-RIB values) in $100 increments ranging from $0 to $100K, for five different non-RIB values ($20K, $40K, $60K, $80K, and $100K):
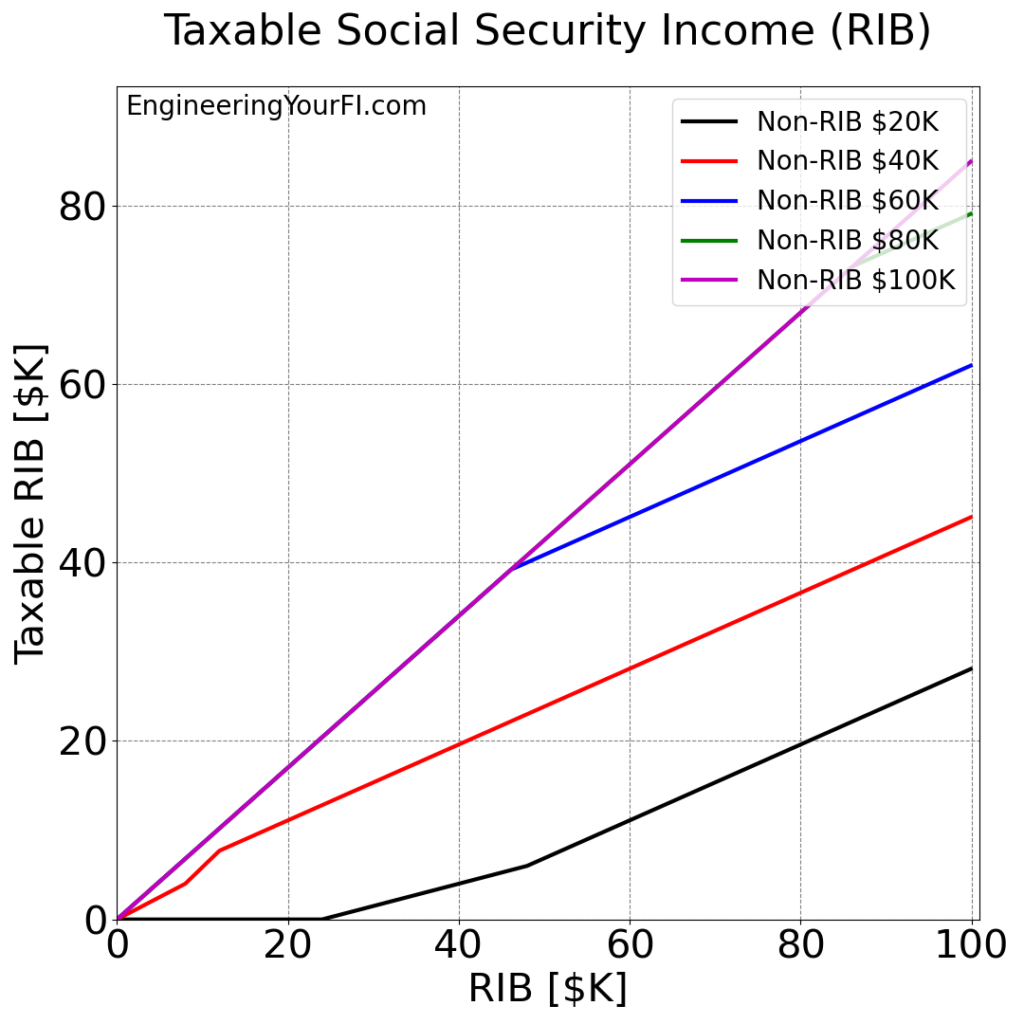
The first thing you might notice is that there is no “leveling off” in this figure, unlike the previous figure. Why?
Well even if you’re at the maximum 85% of RIB for taxable RIB, a growing RIB will mean a growing taxable RIB. So we should never expect a flat line in this kind of plot.
In fact, the magenta line for non-RIB of $100K is ALWAYS at the maximum 85% of RIB, all the way up to $100K RIB.
The green and blue lines for non-RIB of $80K and $60K are also at that max 85% line until they break away with sufficiently high RIB – because 85% of the RIB value is no longer the smaller value when running the Taxable RIB algorithm (see section “Computing Final Taxable RIB” above).
The red line for non-RIB of $40K starts in the 50% bracket, then it first enters the 85% bracket just prior to $10K RIB but RIB is still small enough that the taxable RIB in the 50% bracket is less than half the bracket length (see last paragraph of section “Over MI, but Still Within 50% Bracket” above). With just a bit more RIB though, the taxable RIB in the 50% bracket is just equal to half the bracket length, and it stays that way for the rest of the RIB values. These two transitions explain the two bend points around $10K RIB.
The black line for non-RIB of $20K is ZERO until $24K, at which point it first enters the 50% bracket. It then later enters the 85% bracket, and finishes around $45K at RIB = $100K. Thus it never comes close to reaching the 85% max of RIB.
Filing Status: Single, Head of Household, Qualifying Widow(er), or Married Filing Separately
Now let’s look at the same plots, but for all the other filing statuses (crazy word), which have the same constants as given in section “Filing Status Values” above. I’ve also reduced the maximum RIB considered to $50K, given the discussion in the “Max RIB” section above.
Computing the taxable RIB for non-RIB values in $100 increments ranging from $0 to $100K, for five different RIB values ($10K, $20K, $30K, $40K, and $50K):
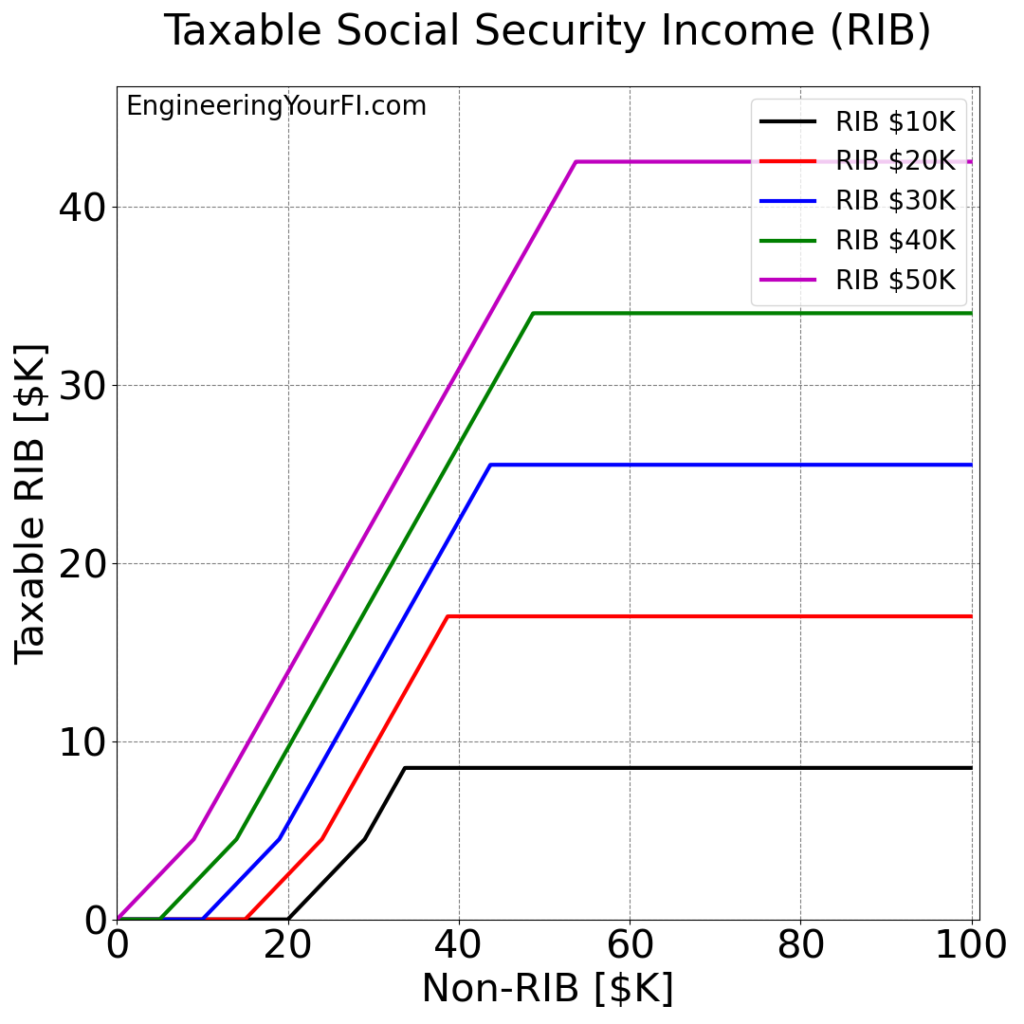
This figure is very similar to the Married Filing Jointly equivalent plot above, with the nice stair-step look and the two bends for each line. Be careful when comparing though: these lines have smaller RIB than the Married Filing Jointly lines, and the vertical scale is smaller as well.
The same conclusions hold though: the more non-RIB you have, the more likely some of your RIB will be taxable, and the more likely you are to have the full 85% of your RIB taxable. And thus if you can reduce your non-RIB income somehow, you might also reduce the amount of your RIB that is taxable (but only if you can reduce it enough to get off that 85% plateau).
Now computing the taxable RIB for RIB values (instead of non-RIB values) in $100 increments ranging from $0 to $50K, for five different non-RIB values ($20K, $40K, $60K, $80K, and $100K):
Again we see that the non-RIB lines of $100K, $80K, and $60K stay at the maximum 85% taxable RIB line, and only the $40K and $20K lines have small enough non-RIB to drop away from that line.
Example Scenarios
OK, that’s a lot of words about algorithms and plots (which of course are very fun, as I’m sure 100% of people will agree), but how about some actual example scenarios? Especially ones where we can take maximum advantage of all this analysis we’ve done?
Roy and Rose: Living the Single Life
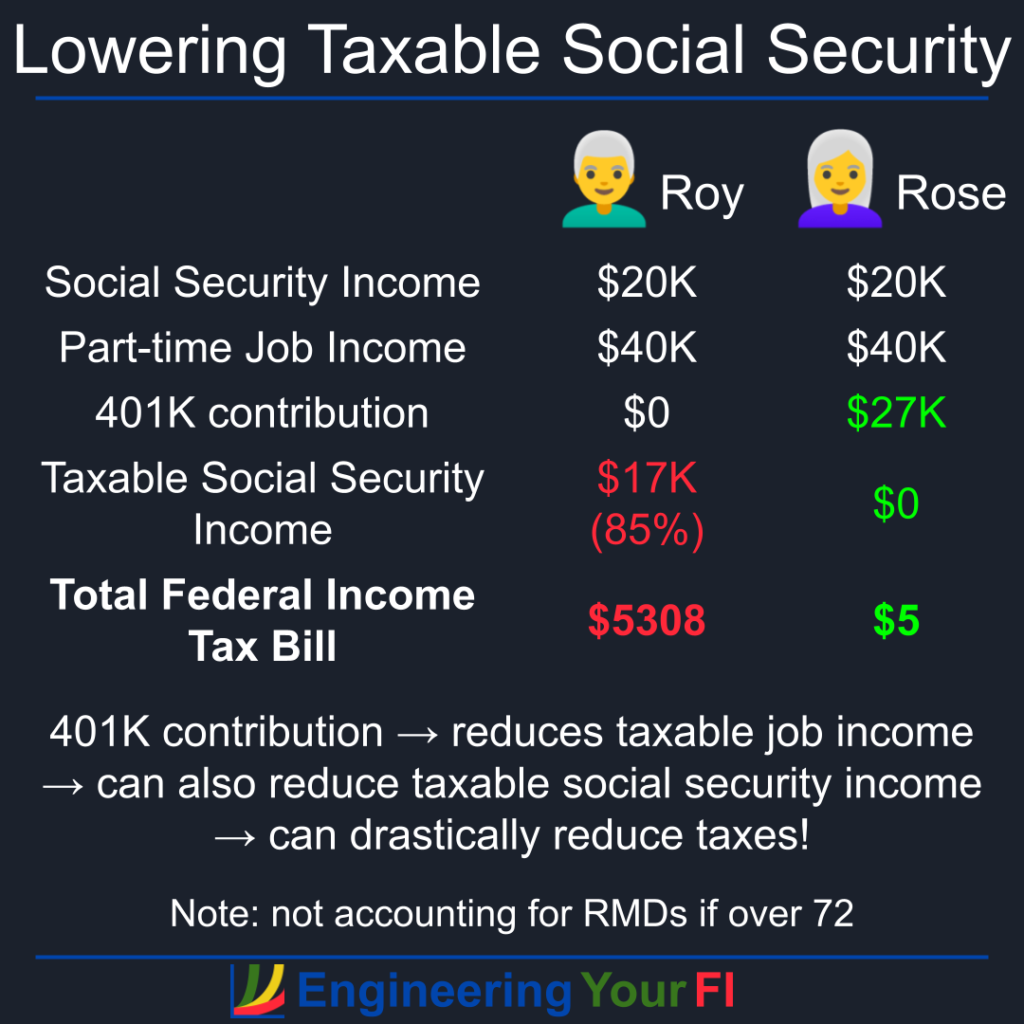
Let’s start with two different single people, Roy and Rose. Both Roy and Rose earn $20K in social security income, and both earn $40K a year working part time jobs in the industries they retired from.
Roy thinks to himself, “well I’m retired, so no need to worry about retirement account contributions anymore”. So he logs into his company’s portal and turns that off.
Rose lives frugally and has a nice nest egg of post-tax assets she can use for expenses, so she decides to not only keep contributing to her 401K, but actually take advantage of the fact that she’s over 50 to push up her contribution to $27K a year (the limit for those under 50).
As a result, Roy will owe taxes on 85% of his social security income, equal to $17K. In contrast, Rose will owe taxes on NONE of her social security income!
The final tax bill Roy will have: $5308.
The final tax bill Rose will have: $5!
See the diagram at the top of the post for a graphical version of this example.
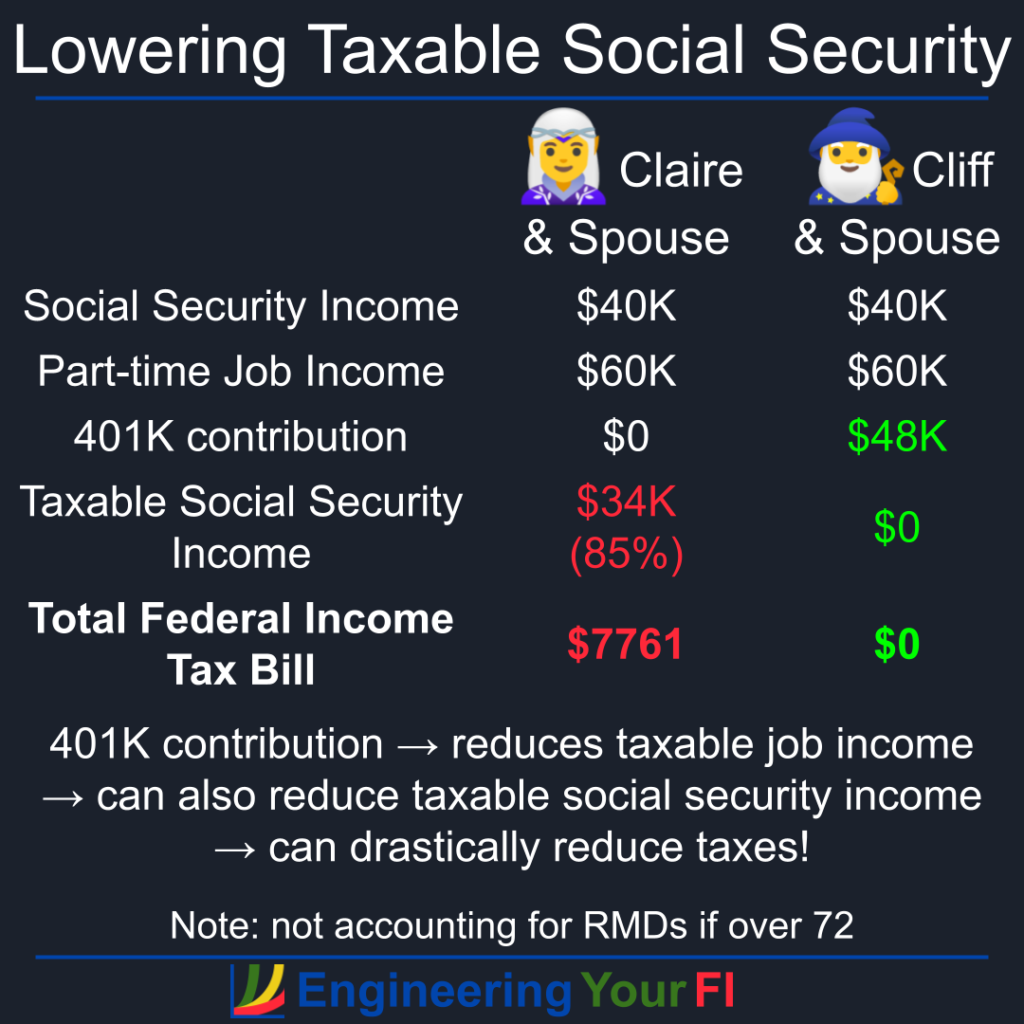
Claire and Cliff: Living the Married Life
Next let’s look at some married folks. Claire and Cliff are both married (to other people, not to each other), and jointly file their taxes each year with their spouses.
Claire and her partner earn a total of $40K in social security income, and bring home $60K a year from the part time jobs they enjoy in retirement. Cliff and his partner also have $40K in social security income and also a $60K yearly income from part time jobs.
Just like Roy above, Claire and her partner don’t worry about retirement contributions anymore.
Just like Rose above, Cliff and his partner live frugally and understand the tax benefits of retirement accounts even when retired, so they each contribute $24K to their 401Ks, for a total of $48K.
As a result, Claire will owe taxes on 85% of her joint social security income, equal to $34K. In contrast, Cliff will owe taxes on NONE of his joint social security income!
The final tax bill Claire will have: $7761.
The final tax bill Cliff will have: $0!!!
Here’s a pretty graphical representation of this example:
Code
If you’d like to plug in your expected or actual social security income and “other income”, as well as filing status, to see how the above plots change (and perhaps do some tax planning to reduce taxable social security income), or if you just want to dig into the code I used to generate the plots and values above, you can download the code or see the embedded Python interpreter below.
Modify the user inputs section at the top as desired, then hit the Run/Play (sideways triangle) button to generate the plots. To go back to the script to make any changes, hit the Pencil icon. If you want the text larger, hit the hamburger menu button, then scroll to the bottom to see larger font options. In that same menu you can also Full Screen the window, and other actions.
Note that you can use the inputs labeled as “Married scenario” and “Other status scenario” to obtain the same plots as above. Use the pound sign “#” to comment out a line so that it’s not used.
Note: any references to “SSI” in the code stand for normal social security income (RIB), not Supplemental Security Income (a different program that is also provided by the Social Security Administration).
Conclusions
I am both surprised and not surprised at how complicated it is to compute how much of your social security income is taxable.
I was surprised because I initially expected it to be more like traditional federal income tax brackets – simply hitting higher rate brackets as the income number goes higher. And I was also surprised I couldn’t find an article anywhere that really cleanly and fully outlined the algorithm – though given the surprising complexity, I guess I shouldn’t be surprised I couldn’t find such an article. Though if you are aware of one, please let me know in the comments!
In the end I was NOT surprised though, given the political and bureaucratic forces that likely shaped these rules. BUT, if you can go through the math yourself, there’s gold in them thar hills! E.g. reducing your standard income somehow could mean quite a bit less of your RIB is taxable.
And as I’ll show in the next article, understanding exactly how your taxable RIB is computed allows you to target a precise standard income such as the standard deduction, which is vitally important in the Tax and Penalty Minimization FIRE withdrawal method.