Last updated: May 19, 2023

This week I spent my time working on building some illustrative diagrams for a couple of my previous posts: Part-Time Work After Financial Independence and Computing Social Security Income.
So unfortunately no new analysis this week.
But I really like to make these diagrams because they force me to think about what’s important for a particular topic / post. And I can put these ideas in front of more folks as well, via social media.
Part-Time Work After Financial Independence – Diagrams
Here are the two diagrams I created for the Part-Time Work After Financial Independence post:


Computing Social Security Income – Diagrams
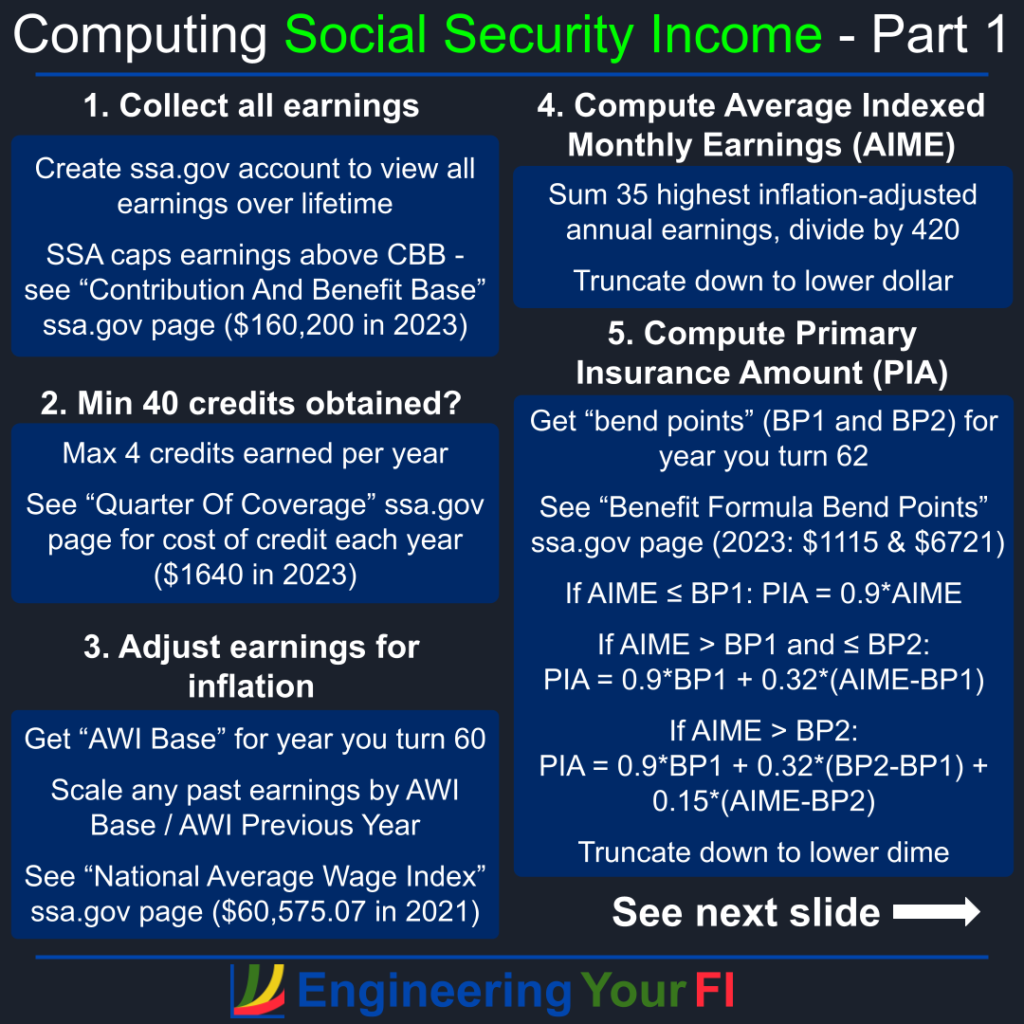
Here are the two diagrams I created for the Computing Social Security Income post:


Putting the entire social security income calculation into a couple of diagrams was definitely the most challenging diagram task I’ve taken on. Initially I tried to put it into a single slide, but you can easily see how crazy that would have been.
Next week I’m hoping to look at the impact of FIRE on social security income, though it’s also my son’s last week of school, so I may have less time than usual. We’ll see!
