Last Updated: February 8, 2023

It’s been another week of lots of work and coding and testing. But, still no results for the stress testing analysis unfortunately. I did come up with a pretty large breakthrough though (I think, TBC once I have results), for handling the main problem I was facing last week.
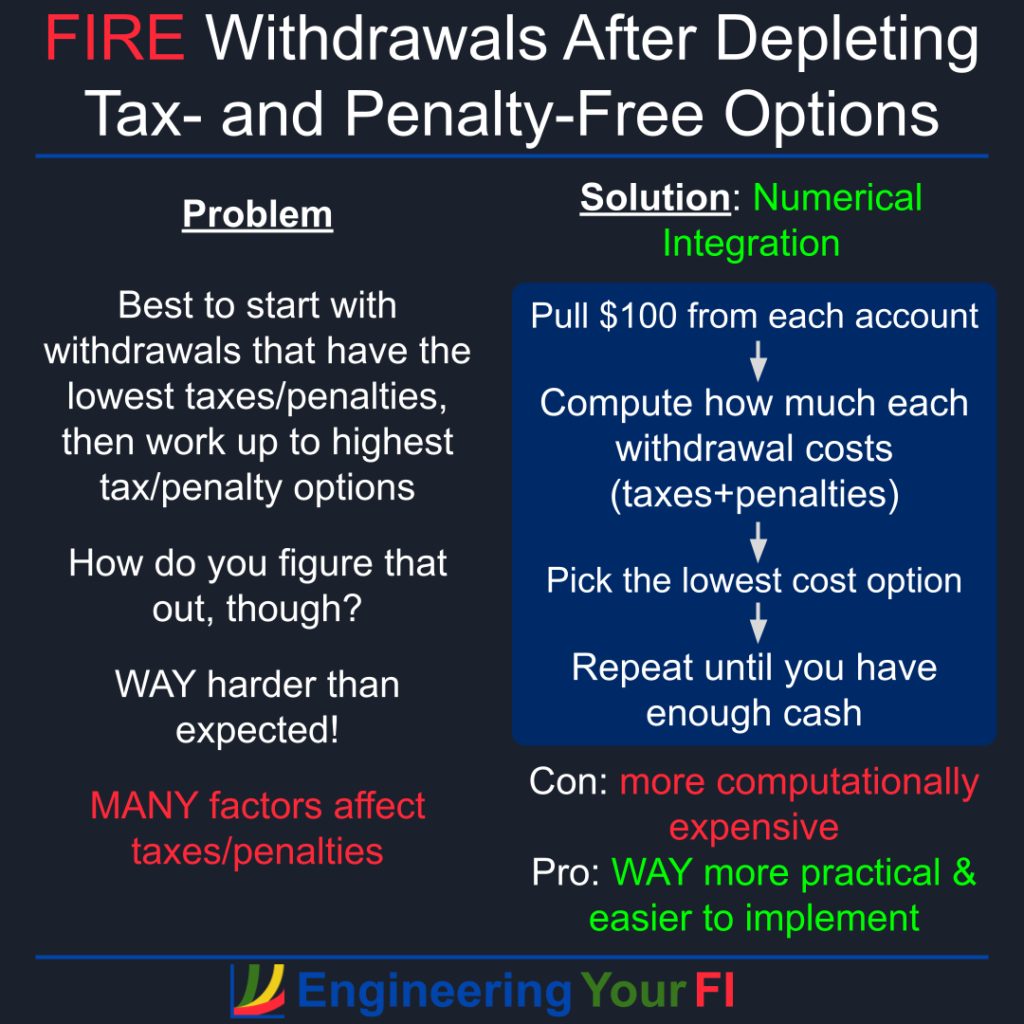
The Challenge
As I mentioned in the last update post, the Tax and Penalty Minimization (TPM) method needs to be expanded to allow for going all the way down to zero assets, as part of this stress testing. I.e., it needs to deplete your accounts as slowly as possible.
I also said last week that doing this extension for the TPM method will be MUCH harder than the traditional method. It definitely has been.
Initially I found myself agonizing over how best to pull money from the accounts once all tax- and penalty-free sources were depleted. Because at that point any further withdrawals will generate extra taxes and penalties, which we want to keep to a minimum.
In particular, I needed to figure out how to specify the order of accounts to pull from, and the amount to pull from each. And these withdrawals should start with the lowest tax+penalty rate option and finish with the highest tax+penalty rate option, so that hopefully the overall taxes and penalties paid will be minimized.
But trying to determine that order fully analytically proved nightmarishly complicated. Some of the major complications:
- If for some reason the user specifies that the TPM method should generate standard income above the standard deduction and/or that the TPM method should generate total income (standard income plus LT cap gains) above the standard deduction + 0% LT cap gains bracket, there will already be non-zero taxes happening in the simulation.
- One person in a couple could be over 59.5 (and thus no longer has to worry about penalties when withdrawing from tax-deferred accounts) and the other person could be under 59.5 (and still has to worry about penalties).
- If social security income has begun, which the Social Security Administration refers to as retirement insurance benefits (RIB), the taxable amount of your RIB is a function of your RIB AND your other income. Which means if you generate standard income by pulling more from your pre-tax accounts, or generate more LT cap gains from selling post-tax lots, then your taxable RIB also may go up. Which increases your taxes further.
- If standard income is increased by pulling more from a pre-tax account, that could push any existing LT cap gains into a higher bracket, since LT cap gains are added on top of standard income.
- When tax brackets are changed each year for inflation, the optimal order of withdrawals could easily change.
The Solution (Hopefully)
After pulling my hair out for a while thinking about all the above complications (and probably others), I finally realized that a “numerical integration” approach was likely the best option. I don’t have results yet (still working on implementing), but I’m reasonably confident this approach will give the optimal set of withdrawals.
Spacecraft Orbits
Uh…. spacecraft orbits? What does that have to do with retirement account withdrawals? Let’s find out.
In essentially all the aerospace analysis and research I’ve done in the past, I employed numerical integration methods to map a spacecraft orbital path forward (or backward) in time. These methods allow you to incorporate as many complex dynamical models as you like, with the intent of simulating all the relevant forces on the spacecraft that will have a significant impact on the spacecraft’s orbit.
And due to the complexity of these models and the orbital motion, it’s effectively impossible to analytically solve for the final spacecraft position and velocity (i.e., plug the initial spacecraft position and velocity into a single equation to get the final position and velocity). Hence the need for numerical integration methods: take one tiny step forward at a time, use the force models to determine how the spacecraft moves during that short time interval, and repeat for the entire simulated trajectory.
All the tax and penalty rate complications I listed in the previous section reminded me of the complex force models in a spacecraft orbit simulation. So employing a similar numerical method approach with small steps seemed like the best approach. Especially for retaining my sanity.
I wonder if I’m the first person in the history of the planet to connect spacecraft orbital motion with IRS tax brackets…
The Method
So, how does this work?
I’ll stick to a broad strokes / high level description here, but I’ll probably eventually provide a more detailed description, likely on the FIRE Withdrawal Strategy Algorithms page.
Once we’ve depleted all tax- and penalty-free sources (e.g., cash in a bank account) and we still need more cash, it’s time to delve into the accounts that will generate taxes and/or penalties.
First we determine how much more total cash is needed – that’s the end point we’re shooting for.
Next we pull a small amount of money out of each possible account (e.g., pre-tax accounts like a 401K or 403(b), a 457(b) account, a Roth account, or a post-tax / brokerage / taxable account).
I’m using $100 for now. But if the simulation can handle it (i.e., it doesn’t take too long), I’ll reduce that number down to $10 or maybe even $1. Or if it’s too slow with $100, I’ll increase it to $1000. But in general, the smaller the increment, the more accurate / optimal the final result will be.
Then we determine how much taxes and/or penalties you’ll owe for each possible $100 withdrawal. And if you have RIB, that also means updating the taxable RIB as needed.
We then select the option that has the lowest overall tax+penalty rate, and execute that withdrawal.
Once the $100 withdrawal is made and we’re $100 closer to our total cash needed, we then repeat the process of evaluating each account for $100 withdrawals and selecting the lowest rate account until we reach the final total cash needed.
Some Caveats
The first caveat is that numerical approaches nearly always require more computing than analytical approaches – sometimes a LOT more. That means we might face quite a bit longer run times, especially for any analysis we want to do that involves evaluating the best path for many different expense levels. We’ll see what happens, but hopefully it’ll still be pretty fast. And there are ways to speed up Python code by pre-compiling, if needed.
Yet even if it’s possible to come up with less expensive (in terms of computation) analytical methods, numerical methods can provide a strong validation of those analytical methods because they take such a different approach. That’s perhaps one of the biggest reasons I’ve decided to implement the above numerical approach: if I somehow come up with a clever analytical approach in the future, this numerical approach will provide a strong validation of the analytical results.
The second caveat is that we are making a big assumption: by always selecting the minimum tax+penalty option for each increment, we will end up with the overall lowest tax+penalty path. However, sometimes in an optimization problem you can end up at a local minimum instead of the global minimum – so hopefully that is not happening here. But if I ever uncover evidence that this approach might not be reaching the global minimum for taxes+penalties paid, I’ll have to make some changes.
Here’s a diagram overview of this new method:
Other Remaining Challenges, Expected Results
As I mentioned last week, I also need to build an iteration capability to handle paying for taxes and penalties with withdrawals from accounts that generate taxes and penalties. So that I can converge on the amount of money that must be pulled from sources that generate taxes and penalties, such that there’s enough money to pay for expenses AND any taxes or penalties incurred.
Fortunately I’ve already done that for the Traditional Method, so hopefully it won’t be too tricky to implement.
I’m hoping after I implement this iteration capability that I can start the stress testing analysis in earnest. And have at least some preliminary results for next week.
I strongly suspect the TPM method will outperform the traditional method in terms of how long your money will last in the same scenario, but I’m very curious to see how much better.
Long Update!
It’s funny, each time I start an “Update” post like this, I believe it will be a relatively short post. I don’t even have any results, how long can it be?
Yet somehow I find lots of things to discuss.
As Mark Twain (allegedly) once said, “I didn’t have time to write you a short letter, so I wrote you a long one.”
OK, I’ll stop typing now.