Last Updated: April 2, 2023

In my last post I covered how to compute Affordable Care Act (ACA) (also known as Obamacare) subsidies, which wasn’t as tricky as I feared.
The next big question in my mind was “How much will your subsidy be reduced if your income grows?”
In other words, for a given chunk of additional income, what can you expect to lose in ACA subsidies?
I’m calling this a “hidden” income tax, because even though most folks refer to ACA subsidies as a good thing (which they are!), losing subsidies with higher incomes is the same mathematically as being taxed on that higher income.
Federal Income Taxes
Before we look at lost subsidies, let’s talk about federal income taxes.
In the US we have a “progressive” income tax system, where the tax rate changes as your income increases.
This tax rate is called the “marginal” rate: the amount of additional tax paid for every additional dollar earned as income.
In fact, it’s pretty easy to plot this marginal rate for each possible filing status versus income:
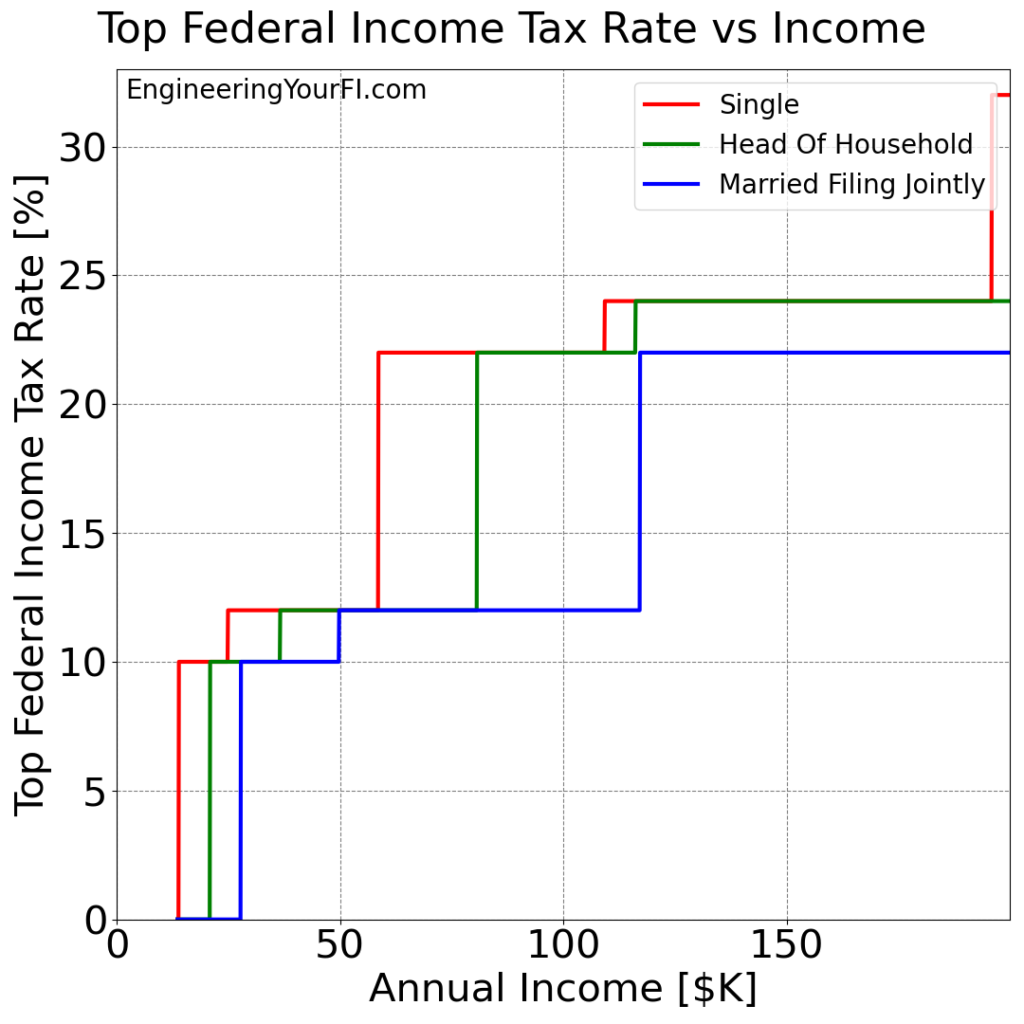
You can easily see the commonly known tax brackets of 10%, 12%, 22%, 24%, and 32%.
Several notes regarding this plot:
- The “Married Filing Separately” filing status values are identical to the “Single” filing status until an income of $346,875 – well past the edge of this plot, so I don’t include “Married Filing Separately”
- The “Qualifying Widow(er)” filing status tax brackets are identical to the “Married Filing Jointly” tax brackets, so I’ve also not included the “Qualifying Widow(er)” filing status
- You can see how the 10% values plots do not start at $0 of income, because I also incorporate the standard deduction in each of the plots
- This plot assumes only standard income, and not any long term capital gains income (which has its own progressive tax bracket)
ACA Subsidy Loss Rates
So if we know that we’ll lose a certain amount of subsidies with each additional chunk of income, we can divide that subsidy loss by that chunk of income to get what we’ll call the “subsidy loss rate”.
Fortunately now that we know how to compute ACA subsidies, we can compute and plot the “marginal” subsidy loss rates for a range of incomes, just like we can plot the marginal federal income tax rates.
Let’s take a look at the same five family scenarios we examined in the previous post, and again we’ll consider income ranging from $13,590 (Federal Poverty Level (FPL) for a single person in the contiguous US) to $200K. And we’ll reduce our step size from $1K to $100, to increase accuracy.
Instantaneous Loss Rate
Instead of plotting the subsidy amount vs income, or the resulting consumer payment vs income for each of the five family scenarios, we’ll plot essentially the SLOPE of the consumer payment plots: the rate you’ll lose subsidies at each income level.
These values I’m calling the “instantaneous” ACA subsidy loss rate, because they are the rate you’ll lose subsidies at that exact income (versus all the subsidies you’ll lose for your entire income – see following plot).
To compute the rate values, I’m employing a “numerical” approach: dividing the loss in subsidy for each extra $100 by the interval ($100).
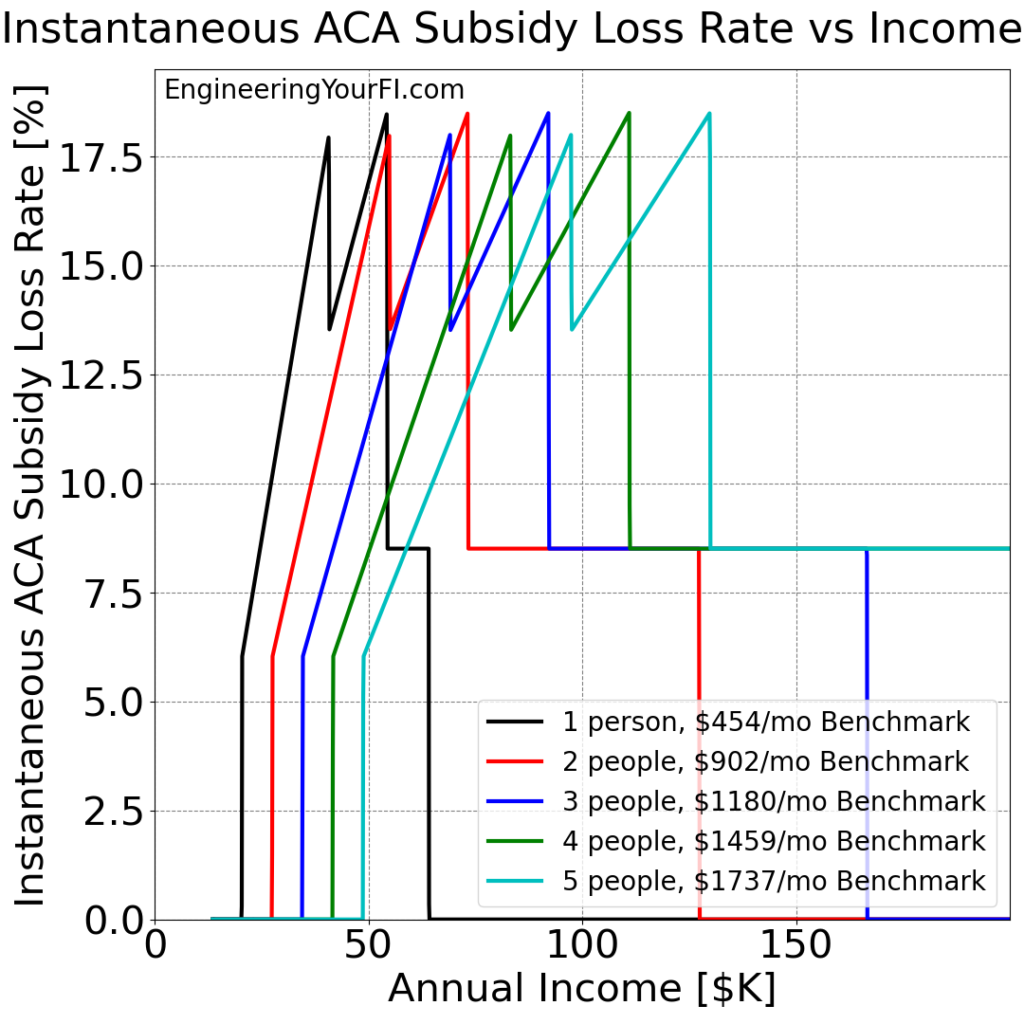
First off, you can see how the loss rates can be pretty dang high! In each of the five scenarios there’s a significant range where the rates exceed 15%, and they can be as high as 18%.
After googling “ACA subsidy loss rates”, I also confirmed that my plots match those created by others, including Wade Pfau at AdviserPerspectives.com (see the “Exhibit 2” plot) and SeattleCyclone.com (see the updated marginal plot for 2021).
Note: my plot doesn’t quite match Wade’s “Exhibit 2” plot in terms of when the rate drops to zero at the end, I believe because he’s assuming a much higher price for the benchmark plan ($1,937.50 per month instead of $902/month, because he’s consider an older couple).
Why the two spikes?
Now, why are there two spikes in each of these five lines? What do those mean?
Well if you take a look at the “Subsidy vs Income” or “Consumer Payment vs Income” plots in the previous post, you can see that the plotted lines are indeed getting steeper until they reach those two points, and then they instantly get less steep, and then resume getting steeper until reaching the constant 8.5% region.
Why the change in steepness though? Because as your income goes up, even though the increase in expected contribution (EC) percentage goes up linearly, it’s a percentage of a HIGHER salary. That means it’s not a linear (straight) curve, which you can see in the “Subsidy vs Income” or “Consumer Payment vs Income” plots. The EC increases exponentially (and thus the plotted line increases exponentially) until the top of the expected contribution bracket.
Once your income reaches a new EC bracket, then the new higher rate applies to a smaller amount of income (since you’re still pretty close to the bottom of the bracket). So that means the instantaneous subsidy loss rate is temporarily lower: see the drop after the first spike in the plots above. That drop happens when moving from the 4% – 6% bracket to the 6% – 8.5% bracket. Then you reach the top of the 6% – 8.5% bracket, it drops to the constant 8.5% rate as expected.
Cumulative Loss Rate
I was also curious about the “cumulative” ACA subsidy loss rate: starting from the point when you begin to lose ACA subsidies (150% of FPL), what is the total subsidy lost divided by the total additional income, all the way up to $200K?
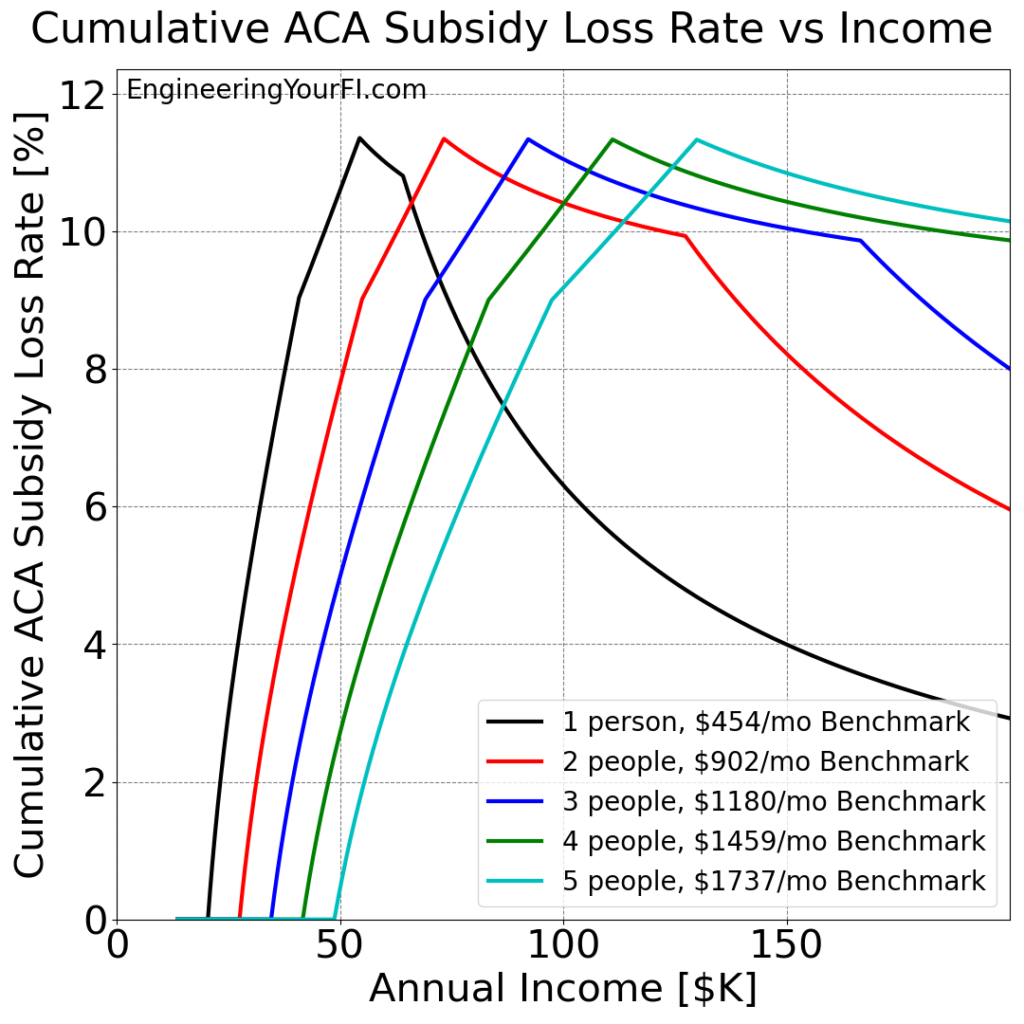
You can see how the cumulative plots initially arch up, and only when each family reaches the 400% FPL mark and the instantaneous/marginal loss rate drops to the flat 8.5% does the cumulative rate begin to drop. And then of course when the subsidy is completely gone and thus the marginal loss rate is 0%, the cumulative rate starts to drop even faster.
Interestingly, the cumulative rate will only approach zero with much higher incomes – it will never get there, because there will always be a non-zero amount of subsidy loss, and thus the fraction of subsidy loss to income (the rate we’re plotting) will never completely reach zero.
Total Tax + Subsidy Loss Rate
Alrighty, now that we’ve got the above federal income marginal tax rates and the marginal ACA subsidy loss rates, what do we get when we add those together?
Let’s consider a couple different scenarios: a single person (family of 1), and a married couple filing jointly with two kids (family of 4).
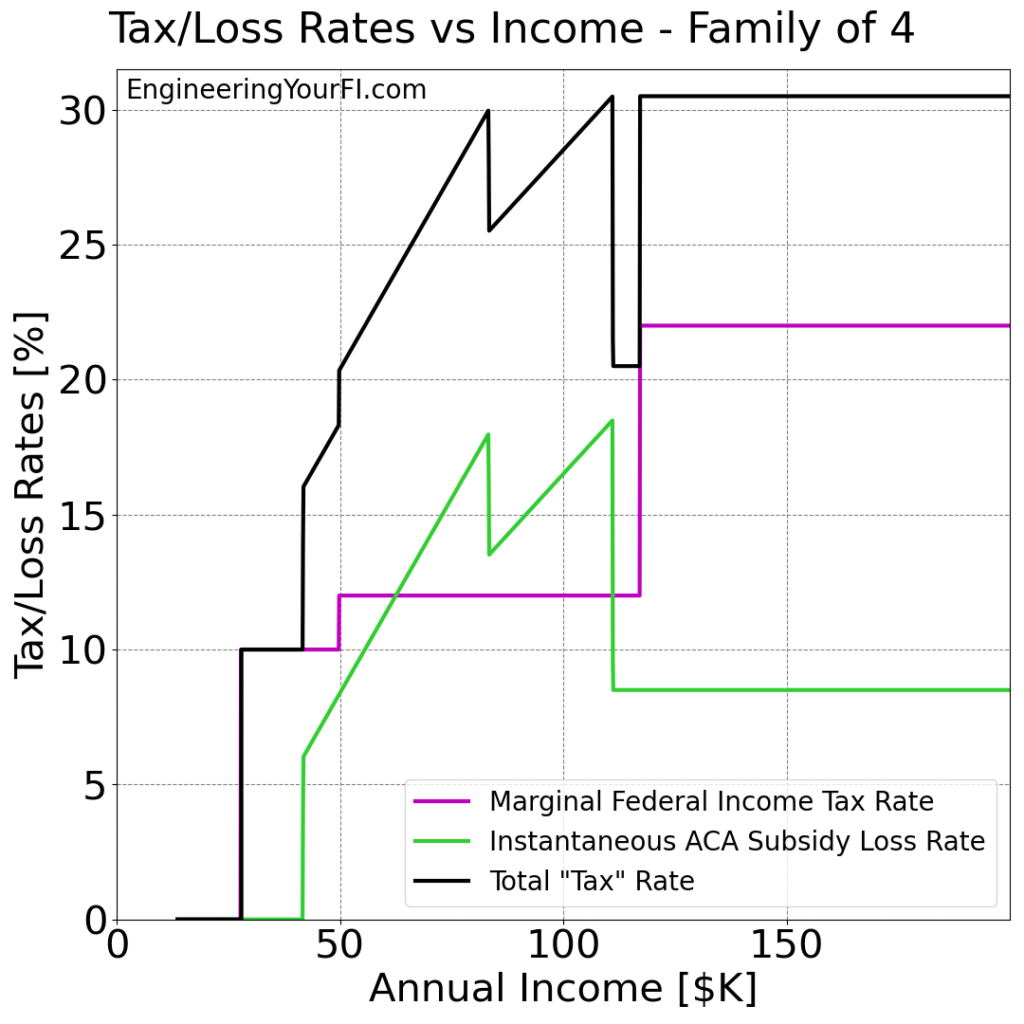
Single Person
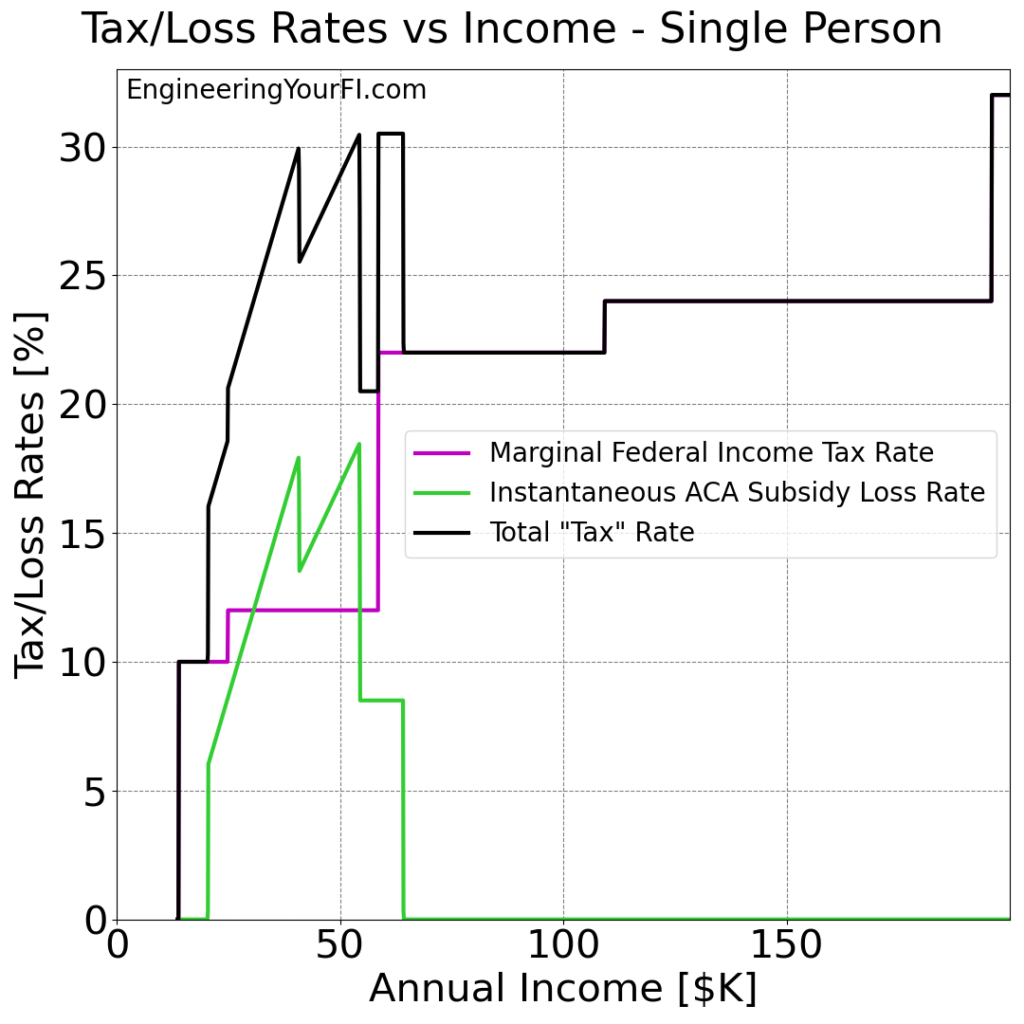
This plot shows how the two rates differ, and provides the total rate when adding them together.
Take a look at the 12% marginal federal income tax rate region: the subsidy loss rate is MUCH higher in that span than the federal income tax rate. Crazy.
Overall, you can see total “tax” rates are MUCH higher than just the federal income tax rate, essentially until the subsidies are completely phased out. In fact, for most of the 12% federal income tax bracket, you actually have a total “tax” rate well over 25%! And sometimes exceeding an eye-watering 30%! Yikes!
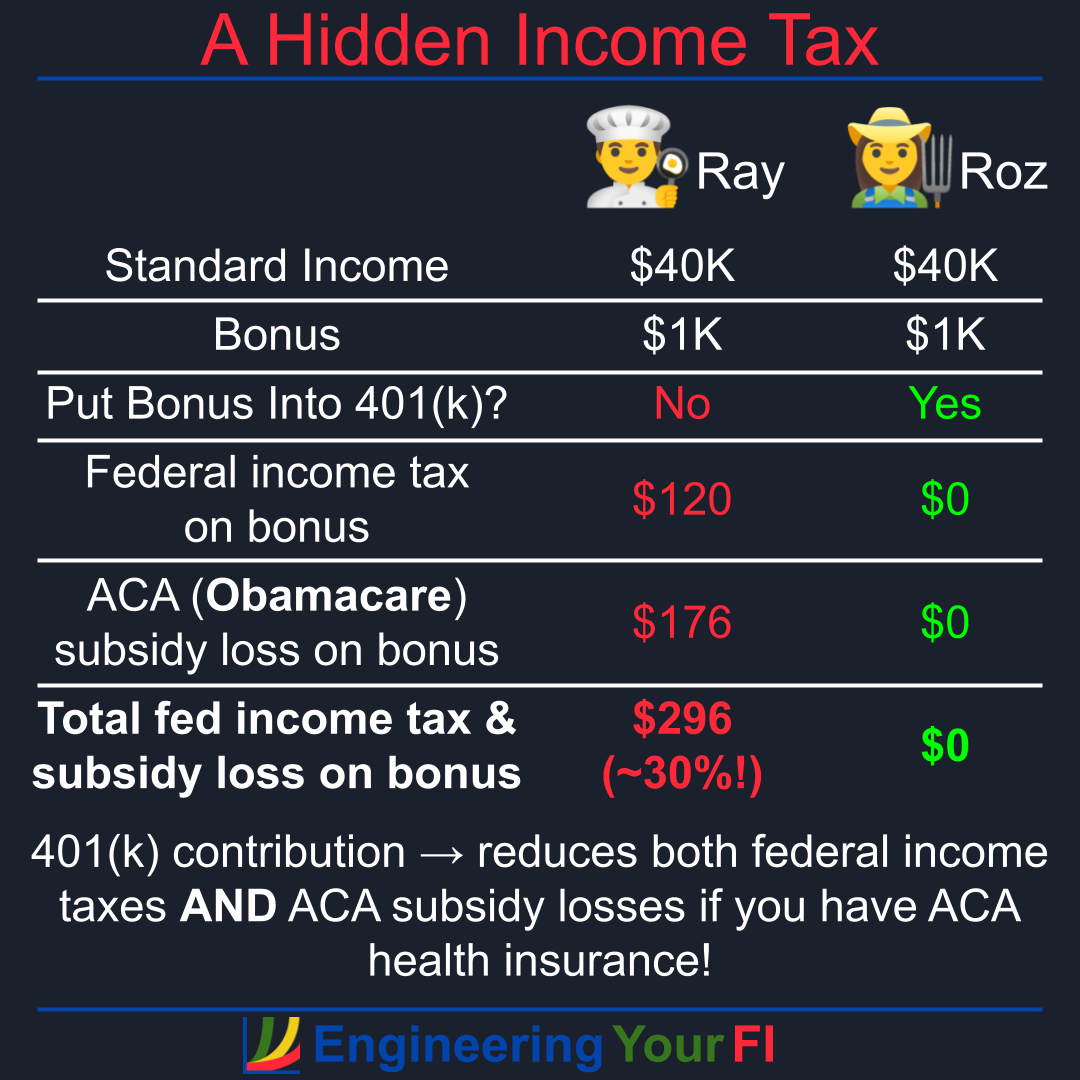
So if this single person has a nominal standard income of $40K, and they get a surprise bonus of $1K, how much do their federal income taxes go up and their ACA subsidies go down? At that income their marginal federal tax rate is 12%, and their ACA subsidy loss rate is 17.6%, so they will lose $120 + $176 = $296 of that $1K extra income. Ouch!
But if they are smart and put that extra $1K into their retirement account(s) (assuming they haven’t maxed them out already), they will save that $296, for a nearly 30% return on their investment! (Of course they’ll still have to pay the 7.65% FICA tax regardless.)
Here’s a nice graphical diagram of that example:
Family of Four
This plot is essentially the same as the previous “single person” plot, just stretched out horizontally into higher incomes. Otherwise the conclusions are identical:
- total “tax” rates are MUCH higher than just the federal income tax rate, essentially until the subsidies are completely phased out
- the entire 12% federal income tax bracket corresponds to a total “tax” rate over 20%, and most of the time it’s 25% (with spikes up to 30%)
- even the 22% federal income tax bracket corresponds to a total “tax” rate over 30% because of the 8.5% subsidy loss rate
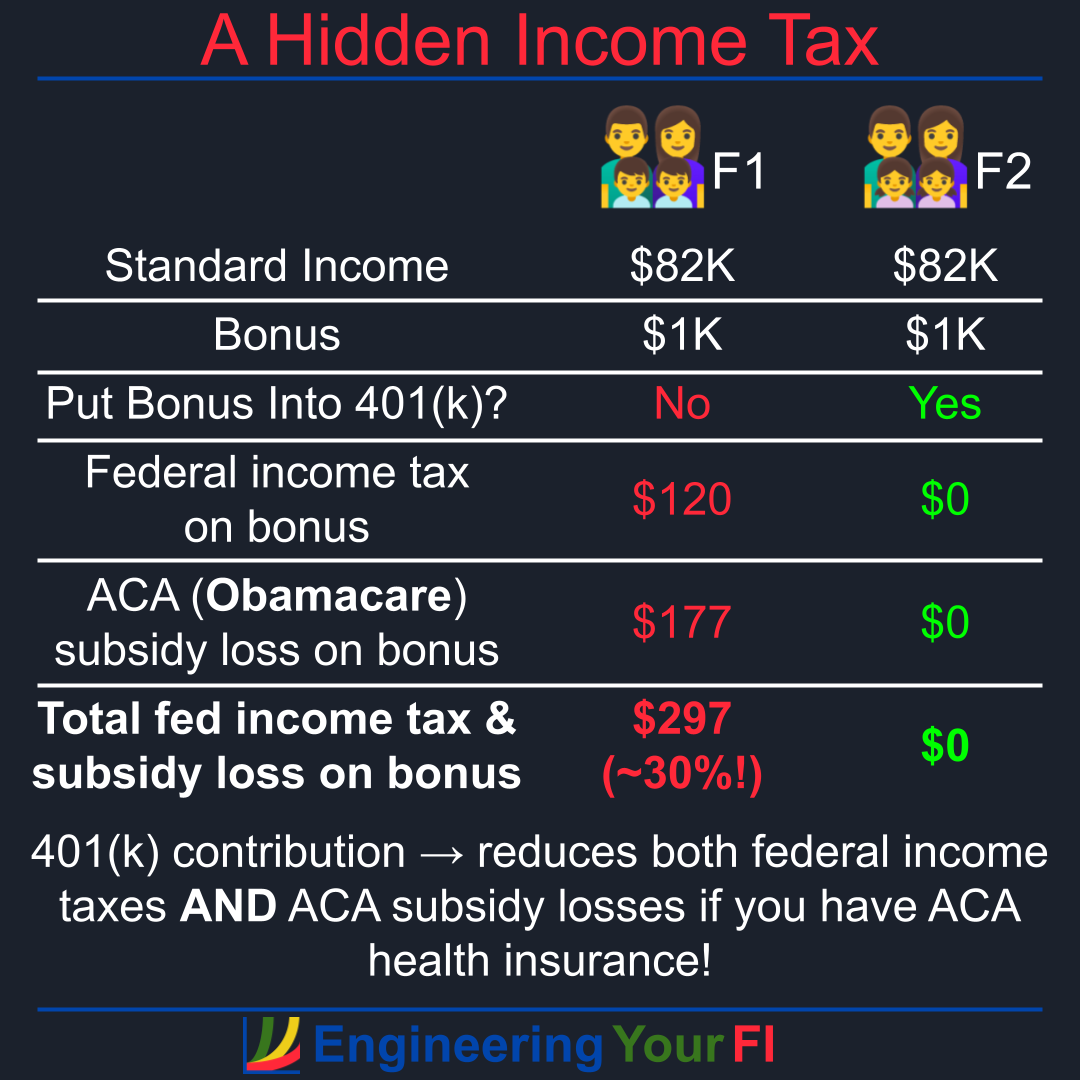
So let’s say this family of four has a nominal standard income of $82K, and they get a surprise bonus of $1K. Their marginal federal tax rate at that income is 12%, and their ACA subsidy loss rate is 17.7%, so they will lose $120 + $177 = $297 of that $1K extra income. A nearly 30% total tax rate! Ouch!
But if they are smart and put that extra $1K into their retirement account(s) (assuming they haven’t maxed them out already), they will save that $297, for a nearly 30% return on their investment! (Of course they’ll still have to pay the 7.65% FICA tax regardless.)
Here’s a nice graphical diagram of that example:
Conclusions
If you get health insurance through the ACA exchanges (Obamacare) and receive subsidies, then it’s vital to pay careful attention to your income (MAGI).
If your income is in a really high marginal subsidy loss rate region, every dollar of income could be “taxed” quite heavily. In that scenario, you should do everything you can to put any extra income you don’t need immediately for expenses into a pre-tax retirement account.
Of course if you’re retired and can target very specific income levels, you will hopefully use only long term capital gains (LTCG) income beyond the standard deduction, so the total tax rate for you will fortunately be just the subsidy loss rate (at least as long as you stay in the 0% LTCG bracket).
Code
If you’d like to plug in your own values and/or play with different family sizes and tax filing statuses, you can download the code or modify and run the embedded Python interpreter below.
Modify the user inputs section at the top as desired, then hit the Run/Play (sideways triangle) button to generate the plots. To go back to the script to make any changes, hit the Pencil icon. If you want the text larger, hit the hamburger menu button, then scroll to the bottom to see larger font options. In that same menu you can also Full Screen the window, and other actions.
Future Work
This post addressed the first question in the Future Work section of last week’s post, but we still have two more questions:
Is it worth increasing your income via long term capital gains to take advantage of the 0% LT cap gains tax bracket (i.e., tax gain harvesting), even if it means a lower ACA subsidy?
I strongly suspect the answer is no, as nearly every simulation I’ve run indicates that any reduction to your assets via taxes or penalties is a net negative in the end. ESPECIALLY any taxes/penalties paid relatively early in your retirement.
If you run out of tax and penalty free withdrawal sources, and you still need more cash for expenses, is it worth reducing your standard income (by reducing pre-tax account withdrawals) and increasing your long term capital gains (by withdrawing more from your taxable/brokerage account) so that you have more cash for the same income? And thus don’t reduce your ACA subsidies?
I honestly do not know what direction this analysis will go. The results in that linked blog post from January show how I could never get this idea to provide a superior result, but being able to retain maximum ACA subsidies as long as possible could give it the power it needs to break through. TBD!
As always, let me know if you like these future work ideas, and/or have any other ideas/recommendations/feedback in the comments below, or shoot me a note.