Last Updated: March 24, 2023

For quite a while now I’ve been interested in figuring out how subsidies are calculated for Affordable Care Act (ACA) health insurance (probably better known as Obamacare, but I prefer ACA because it’s shorter to say and write).
Why? Because health insurance, and all the stress of how to get it when you don’t have access to employer-provided insurance, is a big topic in the Financial Independence (FI) community.
Of course it’s also a huge stressor for millions of folks outside the FI community, especially for entrepreneurs and anyone else that doesn’t have employer-provided insurance and is too young for Medicare.
We are super fortunate in the US that we now at least have the ACA for affordable health insurance, even if it pales in comparison to the universal coverage offered in other countries. However, the amount of government assistance you get for your health insurance is heavily dependent on your income, which leads to lots of questions when trying to minimize your health care spending.
In particular, I’m interesting in the following questions:
- How exactly is the subsidy calculated?
- How much will your subsidy change with changes in your income?
- Is it worth increasing your income via long term capital gains to take advantage of the 0% LT cap gains tax bracket (i.e., tax gain harvesting), even if it means a lower ACA subsidy?
- If you run out of tax and penalty free withdrawal sources, and you still need more cash for expenses, is it worth reducing your standard income (by reducing pre-tax account withdrawals) and increasing your long term capital gains (by withdrawing more from your taxable/brokerage account) so that you have more cash for the same income? And thus don’t reduce your ACA subsidies?
In this post we’ll be tackling just question #1, because we have to create a method for computing the subsidies before we can answer any other questions. We’ll have to save those for future posts. One step at a time!
Computing Subsidies
So let’s dive into how to compute these subsidies! Fortunately it isn’t that complicated.
Federal Poverty Level
First up is computing the Federal Poverty Level (FPL) for where you live and the number of people in your household, which fortunately is quite easy.
Contiguous US:
FPL = $13,590 + (Number of people in your household in addition to you) * $4,720.
Hawaii:
FPL = $15,630 + (Number of people in your household in addition to you) * $5,430.
Alaska:
FPL = $16,990 + (Number of people in your household in addition to you) * $5,900.
Note: the above values are 2022 FPL values for 2023 ACA coverage.
Income As Percentage of Federal Poverty Level
Next up we need to compute how your income compares to the FPL.
For your income, you’ll use your Modified Adjusted Gross Income (MAGI).
What in the world is MAGI? Well fortunately for the vast majority of folks it’s the same as your Adjusted Gross Income (AGI), which you can easily find on your tax return.
If you really want to know what MAGI is, it’s your AGI plus tax-exempt foreign income, tax-exempt Social Security benefits (including tier 1 railroad retirement benefits), and tax-exempt interest.
See? You can probably just use your AGI.
One common question regarding AGI: Do retirement account contributions reduce your AGI? Yes, they do.
So I like to think of AGI as what you have AFTER retirement account contributions and other pre-tax deductions (like health insurance premiums) and BEFORE you subtract the standard deduction or itemized deductions when filing your taxes.
Anyways, after all that discussion of what income to use, computing the appropriate percentage of your income relative to the FPL is easy:
FPL Percentage = MAGI / FPL * 100
If your FPL percentage is at least 100% (and 138% in states that have expanded Medicaid), you’re eligible for subsidies! Hooray!
Note: prior to 2021 and the passage of the American Rescue Plan (ARP), if your FPL percentage was 400% or higher, then you fell off the “ACA cliff”, instantly becoming completely ineligible for any subsidies. Bleh!
Fortunately the ARP eliminated that cliff in 2021 and 2022, and then the Inflation Reduction Act (IRA) extended it through 2025. Hopefully there is sufficient political will and fortune such that the cliff stays dormant for a long time, but ya never know.
Expected Contribution
Next you need to compute your Expected Contribution (EC). This value is basically the amount the government expects you to pay for health insurance.
This calculation uses a set of ranges essentially, mapping your FPL percentage to a percentage of your income (MAGI), which you’ll use to compute your EC.
A common table you’ll see for this mapping is:
| FPL Percentage | Expected Contribution (EC) |
| 100% to 150% | 0% of your income (MAGI) |
| 150% to 200% | 0% to 2% of your income (MAGI) |
| 200% to 250% | 2% to 4% of your income (MAGI) |
| 250% to 300% | 4% to 6% of your income (MAGI) |
| 300% to 400% | 6% to 8.5% of your income (MAGI) |
| Over 400% | 8.5% of your income (MAGI) |
But how is the actual calculation done? See the following equations.
FPL Percentage 100% to 150%:
Expected Contribution = $0 – easy!
FPL Percentage 150% to 200%:
Expected Contribution = (((FPL percentage – 150)/50) * 0.02 + 0) * MAGI
FPL Percentage 200% to 250%:
Expected Contribution = (((FPL percentage – 200)/50) * 0.02 + 0.02) * MAGI
FPL Percentage 250% to 300%:
Expected Contribution = (((FPL percentage – 250)/50) * 0.02 + 0.04) * MAGI
FPL Percentage 300% to 400%:
Expected Contribution = (((FPL percentage – 300)/100) * 0.025 + 0.06) * MAGI
FPL Percentage over 400%:
Expected Contribution = 0.085 * MAGI
Benchmark Price
The last bit of info you’ll need before you can compute your subsidy is the “benchmark price”, which is the price of the second-cheapest silver plan available on the ACA health insurance exchange.
That price will depend on a number of factors, such as your location, the number of people in your household and the number of people seeking coverage, your ages, whether anyone smokes, etc.
Computing that value is definitely outside the scope of this article, but fortunately it’s also very easy to get this value for yourself: just use the estimation tool provided at Heathcare.gov.
After plugging in the required info (should take just a minute, it’s not a lot of info), use the filter to select only Silver plans, and find the premium (before any subsidies) of the second-cheapest plan. Boom, there’s your benchmark price.
Your Subsidy
Finally, with benchmark price and the expected contribution computed above, it’s easy to compute your subsidy:
Annual subsidy = benchmark price – expected contribution
Thus if your FPL percentage is 100% to 150%, your expected contribution is $0, and your annual subsidy will cover the entire cost of your health insurance if you select the second-cheapest silver plan. Not bad!
On the other end of the spectrum, if the expected contribution is greater than the benchmark price, then you get no subsidy for any plan.
Below is a diagram I put together showing the entire calculation:

Calculators
When I first started researching how to compute these subsidies, I found a couple of solid articles that laid it out pretty clearly.
However, after implementing the calculations described above in Python, I also wanted to check my implementation and the numbers I was generating.
Here are the best calculators I found, which you can also use to check your subsidy amount:
- The kff.org subsidy calculator, which fully matched every subsidy value I computed for a wide range of scenarios, and which provides benchmark prices that fully match what I see in the healthcare.gov insurance selection tool.
- The official healthcare.gov insurance selection tool, which also computes your subsidy amount of course. However, the subsidy amount differed from what I calculated by about $21 for some reason I can’t explain. Perhaps it’s using old prices for determining the benchmark price from back during open enrollment?
- The healthinsurance.org subsidy calculator, which exactly matches the healthcare.gov insurance selection tool, which makes me suspect it’s using the exact same dataset (perhaps using old prices)
You can also check out the tool I built in the Code section below.
A Note About CHIP
What It Is
The Children’s Health Insurance Program (CHIP) is “a health care program for children without health insurance whose families earn too much to get Medicaid but cannot afford health insurance.”
Ironically that quote is from the Texas Health and Human Services state government website, and Texas is one of the ridiculous states that have not expanded Medicaid, thus leaving more people without access to affordable health insurance than any other state (about 5.4 million).
Anyways, on paper CHIP provides a lot more coverage for far less money than any ACA insurance plan provides. Covered services include routine check-ups, immunizations, doctor visits, prescriptions, dental and vision care, inpatient and outpatient hospital care, laboratory and x-ray services, emergency services, and mental health services.
Sounds great, right? Especially since it includes dental and vision.
However, my internal “red tape” detector goes off strongly when I read about government run programs that are designed for lower-income folks such as this.
When searching for how good CHIP is in practice, the only remotely helpful content I found was a reddit thread started years ago by someone with essentially the exact same question. And there are a number of folks in that thread that recount horror stories about CHIP, including lack of support for it in many medical practices and nightmarish paperwork and bureaucracy (especially when first starting it, with some kind of insanely long waiting period involved).
Why is it so hard to find information about how good or bad CHIP is in practice? And how widely accepted it is? Because so few people are on it? Because it’s so good that people never complain about it? Because most folks that are on CHIP don’t have the time/resources to devote to ranting about it on the internet?
Anyways, at this point overall I’m not convinced having your children on CHIP is worth the much lower cost you’d pay to insure your kids (if you have a choice in the matter, as most folks who are FI or are on the road to FI probably do).
BUT, let me know if you’ve heard or experienced otherwise!
How To Avoid It
Speaking of having a choice in the matter, how DO you choose whether to have your children on CHIP or be covered by the same ACA plan you’re on?
Well it turns out that if your income (MAGI) is below a certain threshold (which depends on the state you’re in), then your kids will become eligible for CHIP – and thus NOT eligible for ACA subsidies!
So how do you find that threshold? Well, you can look it up for your state and do the math, or you can simply plug your numbers into the healthcare.gov insurance selection tool and then reduce the income value until you see a BIG drop in the subsidies and a note indicating that your kids are no longer eligible for subsidies because they are instead eligible for CHIP.
Once you know that threshold, then that’s the minimum income you must target to ensure your kids do not lose those vital ACA subsidies.
So for example, here in Texas, the income limit is 206% of the FPL. For a family of 4, FPL = $30K, so 2.06 * $30K = $61,800. So that Texas family needs an income (MAGI) of $62K or higher for their kids to not lose ACA subsidies. And in New York, a family of four needs an income of $121,500! Crazy!
Note: while 2022 FPL values are used for 2023 ACA coverage, it appears they use 2023 FPL values for determining 2023 CHIP eligibility.
Another note: while I compute subsidies down to the 100% FPL level in the “Plots” section below, in reality the subsidies will drop heavily when the income value drops below this “CHIP eligibility” threshold (which is different for each state).
A Note About Silver Loading
Something to be aware of these days is a relatively new process called “Silver Loading”.
I won’t go into detail regarding how it works or why it exists (see the linked article if you’d like more info), but the end result is that very often you will find a much better deal looking at Gold plans than Silver plans. Especially if you live in Texas or New Mexico, which both now mandate silver loading by law.
So make sure you check all metal levels when looking at the exchange plans, and don’t just look at silver plans!
For our family here in Austin, I found a good gold plan that had better benefits and cost many hundreds of dollars less per year in premiums than the best silver plan I could see. Quite the no-brainer.
Example Scenario
Alrighty, let’s use the above math to figure out the subsidies for a nice example family: the married couple Allen and Brooke, with their kids Charles and Darcy.
This family lives in Texas and has a household income (MAGI) of $62K. That puts them at 223.42% of the 2022 FPL (used for 2023 ACA coverage).
That FPL percentage means their expected contribution percentage of their income is 2.94%. With an income of $62K that means they are expected to contribute $1,820.90 per year towards health insurance.
The annual benchmark price (second-cheapest Silver level plan in their area and for their family) is $1,458.76/mo * 12 months = $17,505.12.
Thus their annual subsidy is $17,505.12 – $1,820.90 = $15,684.22.
And thus the monthly subsidy is $15,684.22 / 12 = $1,307.02.
Tax On Higher Incomes
Now what if Allen and Brooke have a good year at work and make $63K instead of $62K? Well then their annual subsidy would be $15,564.04, which is $120.18 lower. That means they are essentially “taxed” 12% for that additional $1K of income! Bleh!
Fortunately, if Allen and Brooke increase their retirement account contributions by $1K that year, they will continue to get that higher subsidy! Because subsidies are based on MAGI, lowering their MAGI via retirement account contributions can preserve their subsidies.
So definitely take maximum advantage of your retirement account contributions to keep your taxable income as low as possible and thus maximize your subsidies.
(Though also be careful to not bring your income below the CHIP threshold discussed above, if you want to have ACA subsidies for your kids.)
I plan to do further analysis and build some plots showing how this “tax/penalty” of lower subsidies for higher incomes looks for a variety of situations in a future post.
Plots
Now let’s look at some plots! I love me some plots.
Subsidies Provided
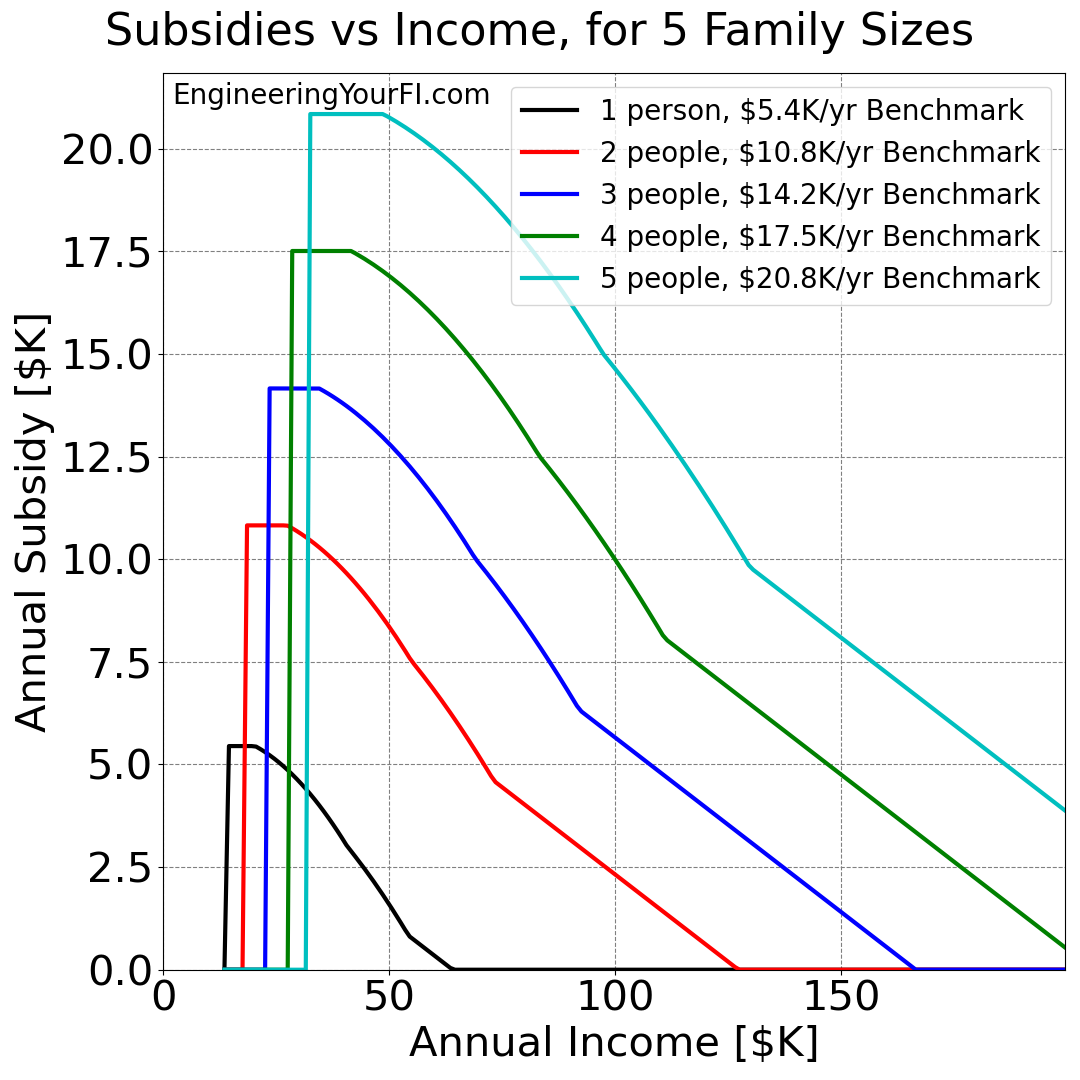
Let’s look at the amount of subsidies provided versus income for a variety of family sizes, from 1 to 5 people.
First though, we need to know what the benchmark prices are for each family size. Using the healthcare.gov insurance selection tool with our zip code, I got the following benchmark prices:
- 1 person: $454/month
- 2 people: $902/month
- 3 people: $1,108/month
- 4 people: $1,459/month
- 5 people: $1,737/month
Of course these prices will vary heavily depending on what part of the country you live in, the age of the household members, etc. But I think they are reasonably representative for the purposes of these plots.
Let’s now plot the annual subsidies for incomes ranging from $13,590 (which is the FPL for a single person in the contiguous US, and thus the lowest possible income you can have and still receive subsidies) to $200K (just a nice high round number):
We can also divide all these annual subsidy values by 12 to get the monthly subsidy values:

You can see how each plot zooms up to 100% of the benchmark price after they hit that 100% FPL threshold, and then starts to drop off once the 150% FPL percentage is passed. There’s no “ACA cliff”, so once each plot reaches the 400% FPL percentage, it has a constant slope downwards to $0. Neat!
So if you’re wanting to maximize your subsidies, ideally you want to aim for that 150% FPL percentage, right where the subsidies start to decrease. But if you need to go higher, say to keep your kids out of CHIP, then you’ll want to keep your income right above that CHIP eligibility threshold.
We can also divide all the subsidy values by the benchmark prices for each family size:
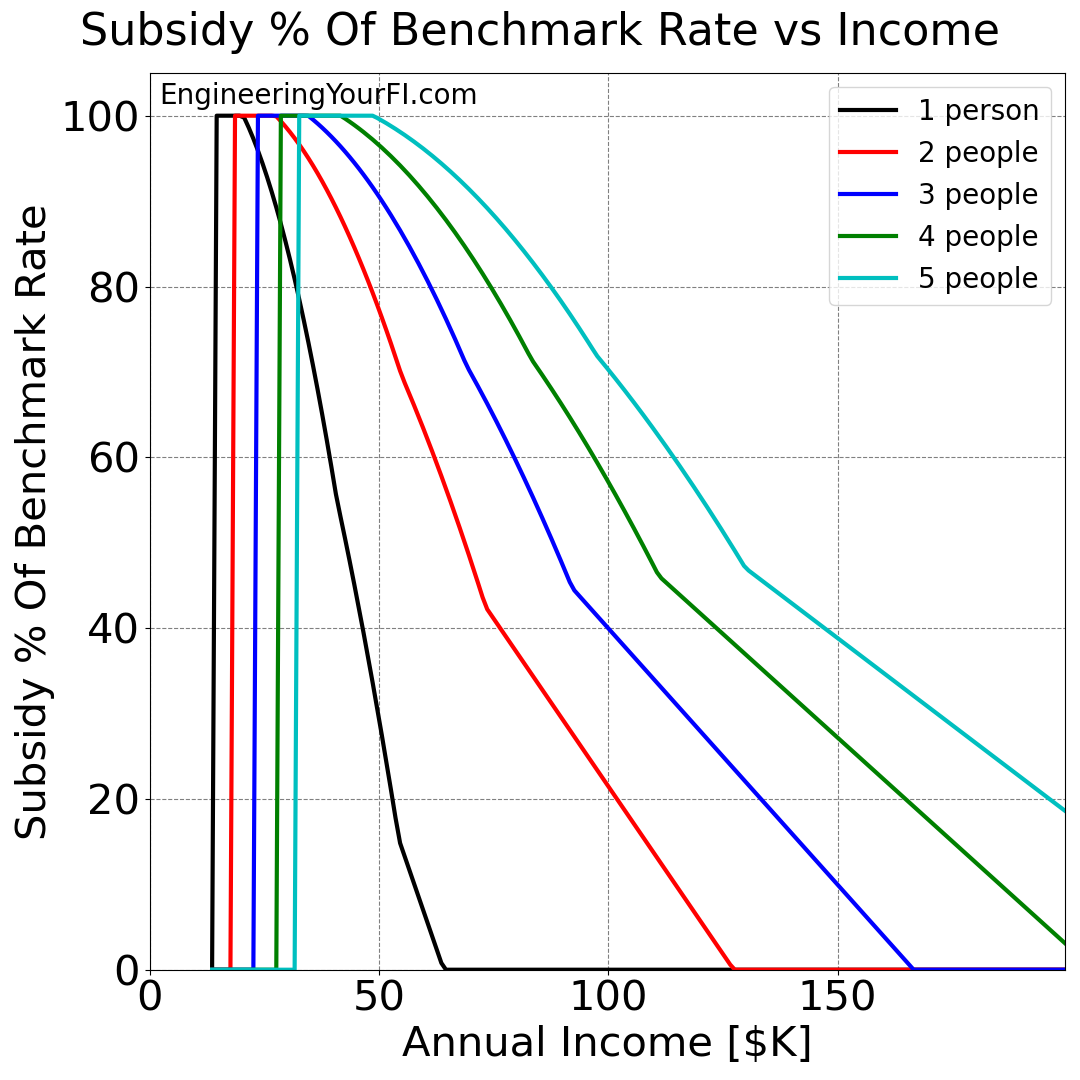
I really like this plot, because it allows us to “scale”, or “normalize”, the subsidy values and thus have a better sense of how the subsidy compares to the benchmark price.
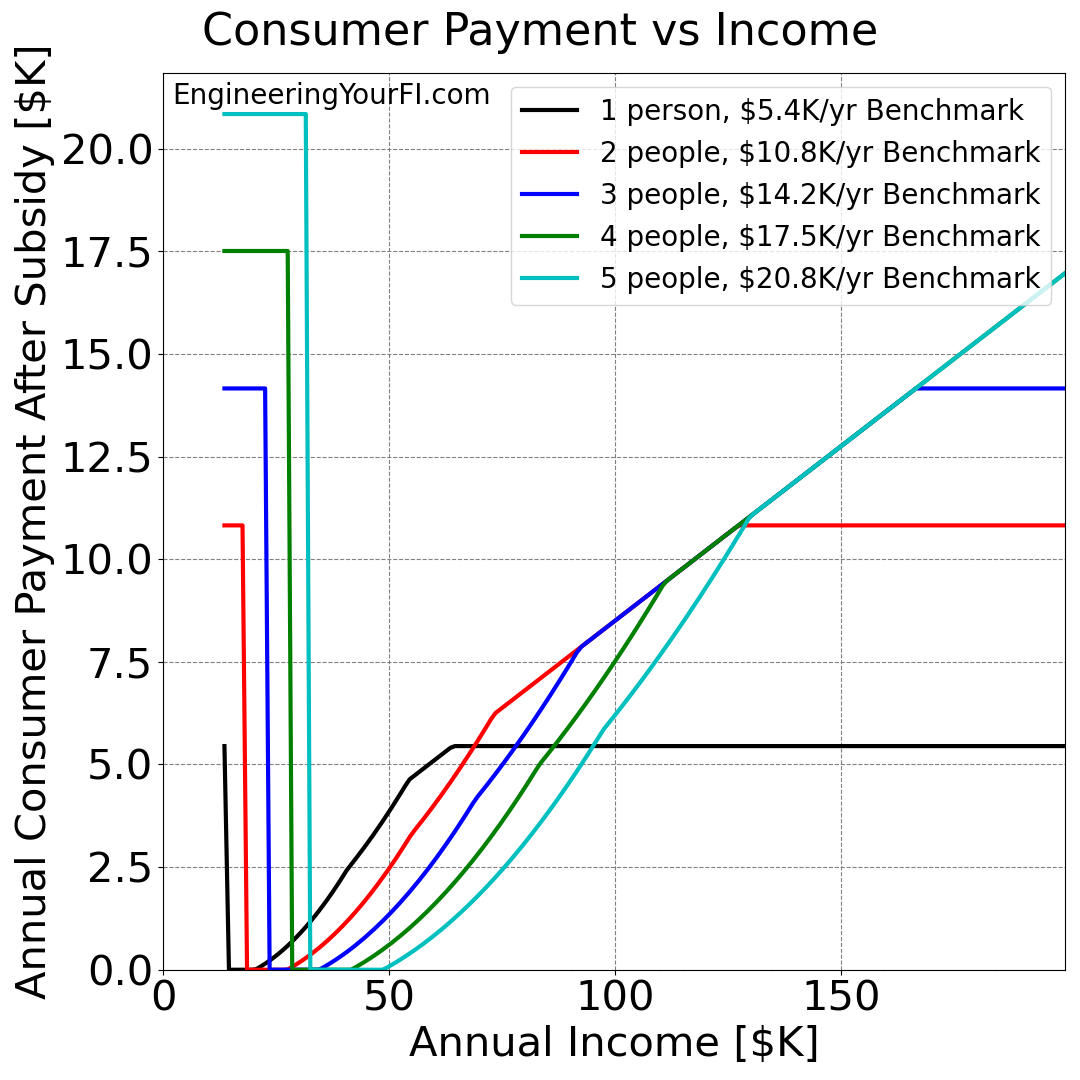
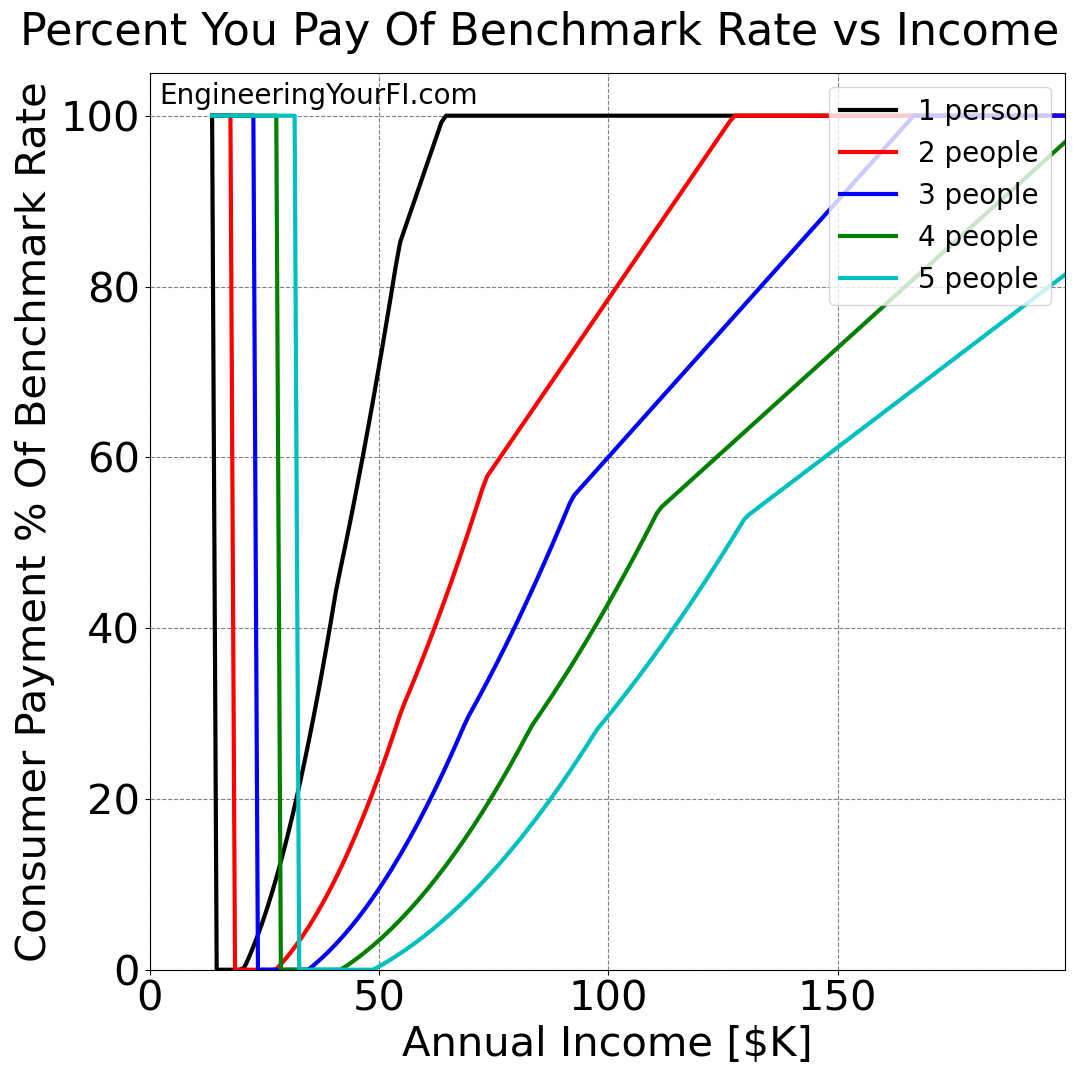
Consumer Payment
It’s also easy enough to essentially reverse the above plots and show how much each family will pay after subsidies.
Starting with how much they’ll pay each year:
And how much they’ll pay each month:
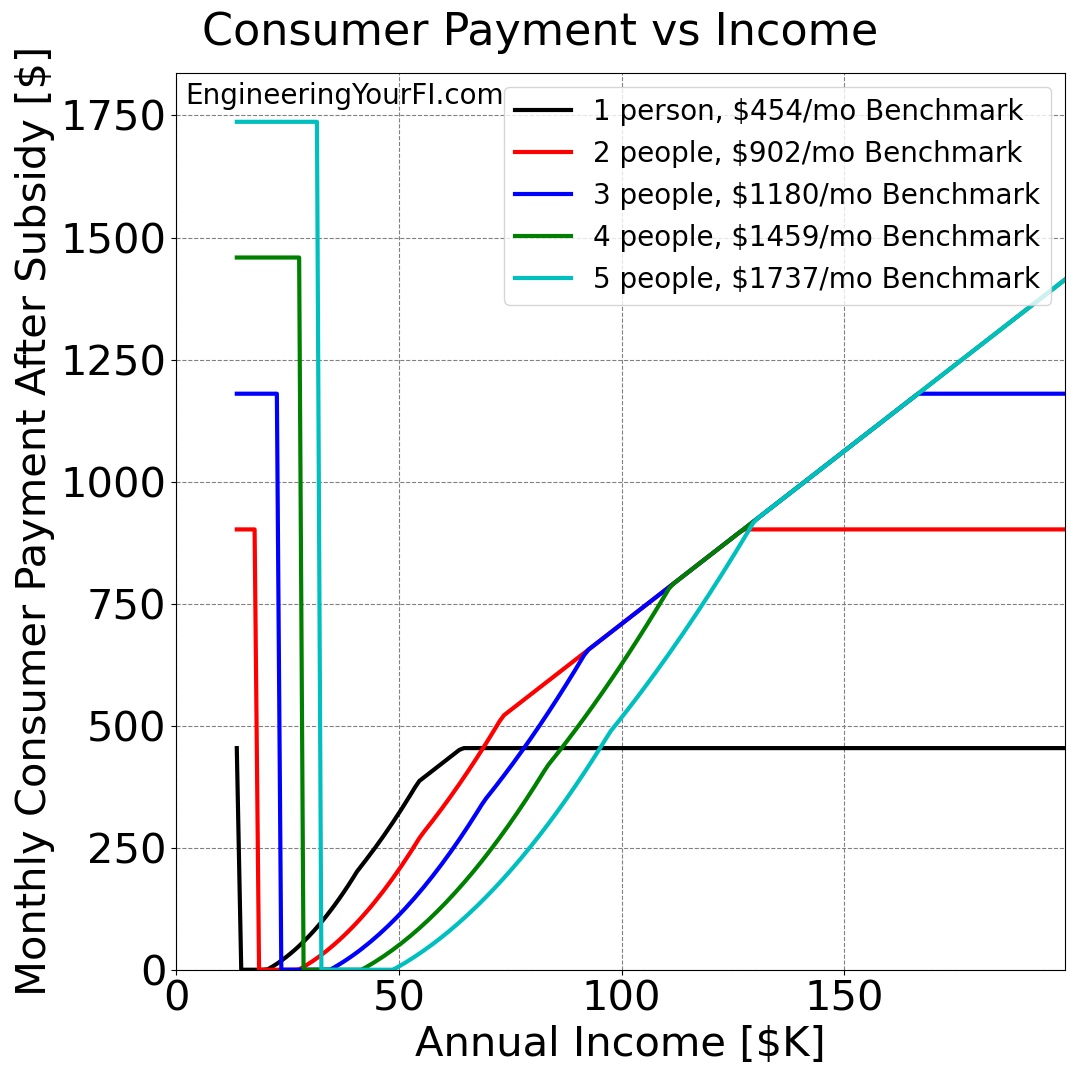
You can see how the consumer payment drops to $0 as soon as each household reaches the 100% FPL percentage, then stays at $0 until reaching the 150% FPL percentage, and then goes up until reaching the benchmark price when no more subsidies are provided.
What’s really interesting is how the lines start to overlap around $100K of income, and then separate again when reaching the benchmark price.
And we can scale how much each family will pay by the benchmark price as well:
Again, the payment drops to zero, then stays there a little while, then increases until reaching the full benchmark price with no subsidies. Very neat.
Code
If you’d like to plug in your own values and/or play with different family sizes and tax filing statuses, you can download the code or modify and run the embedded Python interpreter below.
Modify the user inputs section at the top as desired, then hit the Run/Play (sideways triangle) button to generate the plots. To go back to the script to make any changes, hit the Pencil icon. If you want the text larger, hit the hamburger menu button, then scroll to the bottom to see larger font options. In that same menu you can also Full Screen the window, and other actions.
Future Work
The main future work for this analysis is addressing questions #2, #3, and #4 at the top of this post.
How much will your subsidy change with changes in your income?
I provided a brief demonstration in the example scenario above, but I’d like to do a much deeper dive, including building some plots that show this “tax/penalty” of lower subsidies for higher incomes looks for a variety of situations.
Is it worth increasing your income via long term capital gains to take advantage of the 0% LT cap gains tax bracket (i.e., tax gain harvesting), even if it means a lower ACA subsidy?
I strongly suspect the answer is no, as nearly every simulation I’ve run indicates that any reduction to your assets via taxes or penalties is a net negative in the end. ESPECIALLY any taxes/penalties paid relatively early in your retirement.
If you run out of tax and penalty free withdrawal sources, and you still need more cash for expenses, is it worth reducing your standard income (by reducing pre-tax account withdrawals) and increasing your long term capital gains (by withdrawing more from your taxable/brokerage account) so that you have more cash for the same income? And thus don’t reduce your ACA subsidies?
I honestly do not know what direction this analysis will go. The results in that linked blog post from January show how I could never get this idea to provide a superior result, but being able to retain maximum ACA subsidies as long as possible could give it the power it needs to break through. TBD!
And as with many other tools on this site, it would be neat to one day put this capability in a nice graphical interface. However, I’ll admit that given how many other good ACA subsidy calculators are available online, I’m not sure that would be the best use of time & energy. Until then, you can run the Python code yourself, either on your own or via the embedded python interpreter in the Code section above.
As always, let me know if you like these future work ideas, and/or have any other ideas/recommendations/feedback in the comments below, or shoot me a note.