Last Updated: March 7, 2023

Last week I implemented an idea I’ve had for quite a while to further enhance the Tax and Penalty Minimization (TPM) withdrawal method. However, I couldn’t seem to get improved results for any scenario I tried.
This week I dove a bit deeper to better understand why this method is not working out.
The Idea and Execution (Short Versions)
Last week’s post went into greater detail about this idea and how I implemented it, but here’s a quick summary:
If you run out of tax and penalty free withdrawal sources, and you still need more cash for expenses, it might be beneficial to reduce standard income by reducing your pre-tax account (e.g., Traditional IRA) withdrawals (usually set to the standard deduction) and increase your long term capital gains by withdrawing more from your taxable/brokerage account (which will give more cash than you pay in capital gains). That could mean avoiding taxes/penalties, which could pay off big time down the line.
To implement this idea, I employed a numerical integration method similar to the method I’ve used previously:
- withdrawing enough taxable/brokerage funds to achieve $100 in capital gains
- if that withdrawal increased tax bill, then also “undo” any pre-tax withdrawals by $100
- repeat until enough cash has been generated
Example Scenario
The majority of scenarios I tried were totally unaffected by this new method: by the time penalty and tax free withdrawal sources were depleted, the taxable account was empty. Or, additional taxable account withdrawals did not produce a greater tax bill, because it was still within the 0% LT cap gains bracket.
I started with the Bill and Barbara “married filing jointly” scenario, but I had no luck getting the method to be applicable, even with very aggressively high annual expenses. I then switched to the Betty “single” scenario, because the top of the 0% LT cap gains bracket is much lower.
Even then though, I had to make several important changes:
- I raised Betty’s expenses from $40K/year to a quite strenuous $69K/year
- I raised the LT cap gains for all of Betty’s taxable account lots, from 30% of the lot values to 80% of the lot value – otherwise LT cap gains weren’t large enough
- I had to move all of her 457(b) funds into the standard pre-tax account (e.g., Traditional IRA) – because the lack of penalty on 457(b) withdrawals made things too easy to need the new method
- I had to entirely kill the dividend from the taxable account – again, too much cash, making things too easy
After those changes, I could then see that the new method was consistently called – it ran out of tax and penalty free money, still needed more cash, and the taxable account wasn’t empty.
So, now I should see some nice positive improvement in the results, right? Unfortunately, no.
Results: No Improvement, Sometimes WORSE
Assets
First off, let’s look at Betty’s assets over time with the new method off:
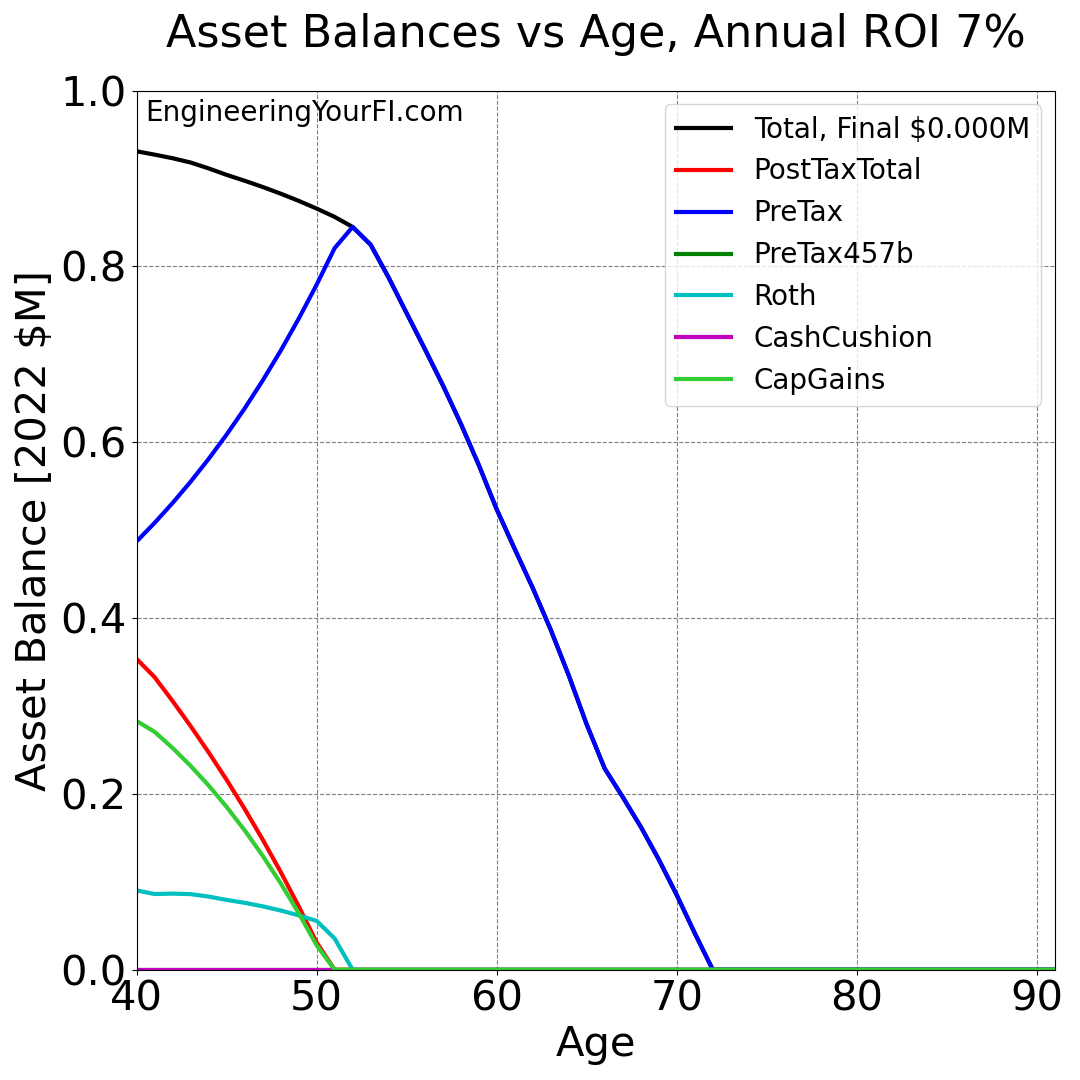
She runs out of money at age 72, which isn’t too surprising given her $69K/year expenses and the other changes I made to the original Betty scenario. What if we turn on the new method though, which will hopefully reduce Betty’s taxes and penalties especially in the early years?
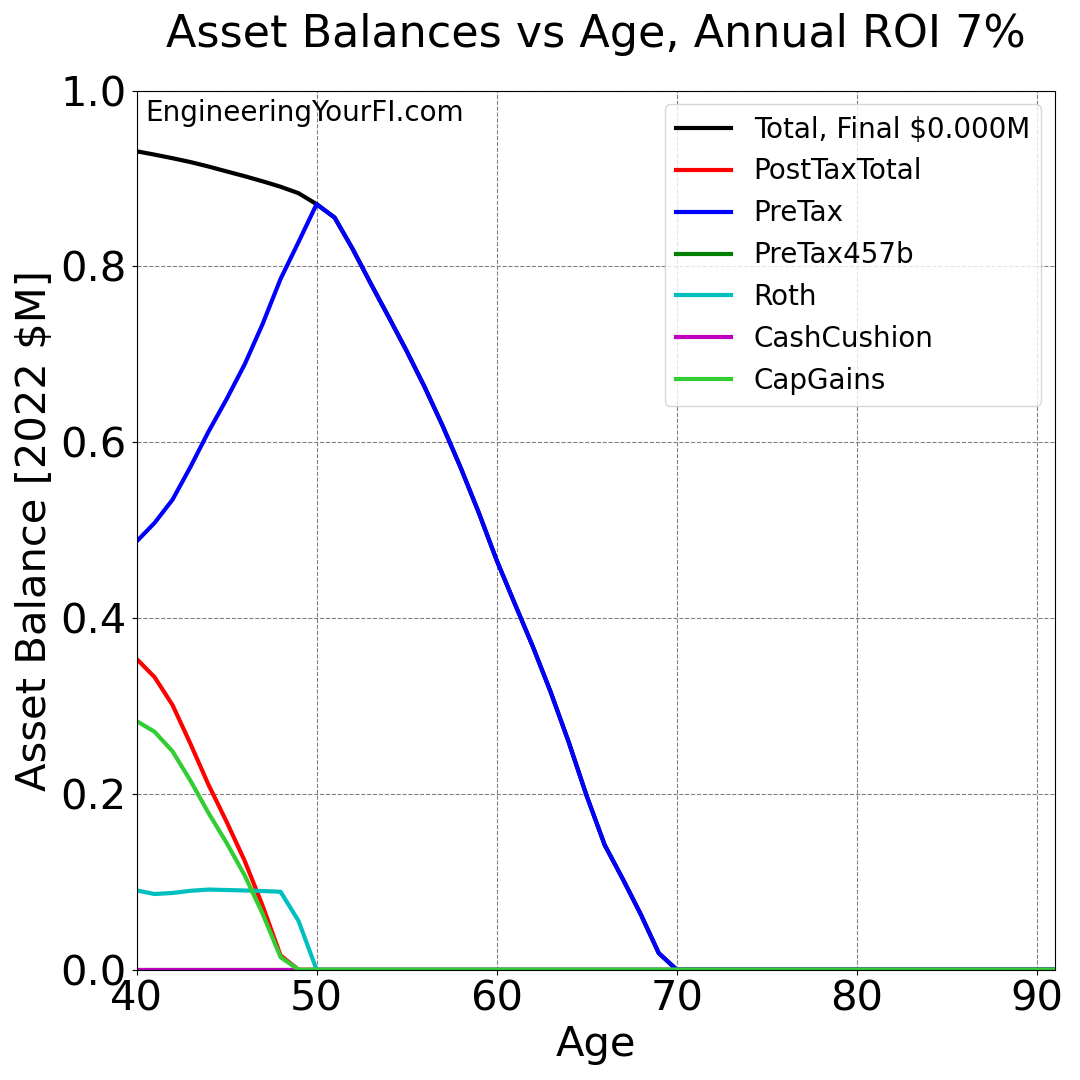
Hmmm…. she actually runs out of money SOONER, at age 70 instead of 72. Bleh! so not only did the new method not help, she actually ran out of money FASTER.
To better understand how these two plots differ, I plotted the difference of each line, where the scenario values with the new method OFF are subtracted from the scenario values with the new method ON (so should see lines ABOVE zero if the new method actually helps):
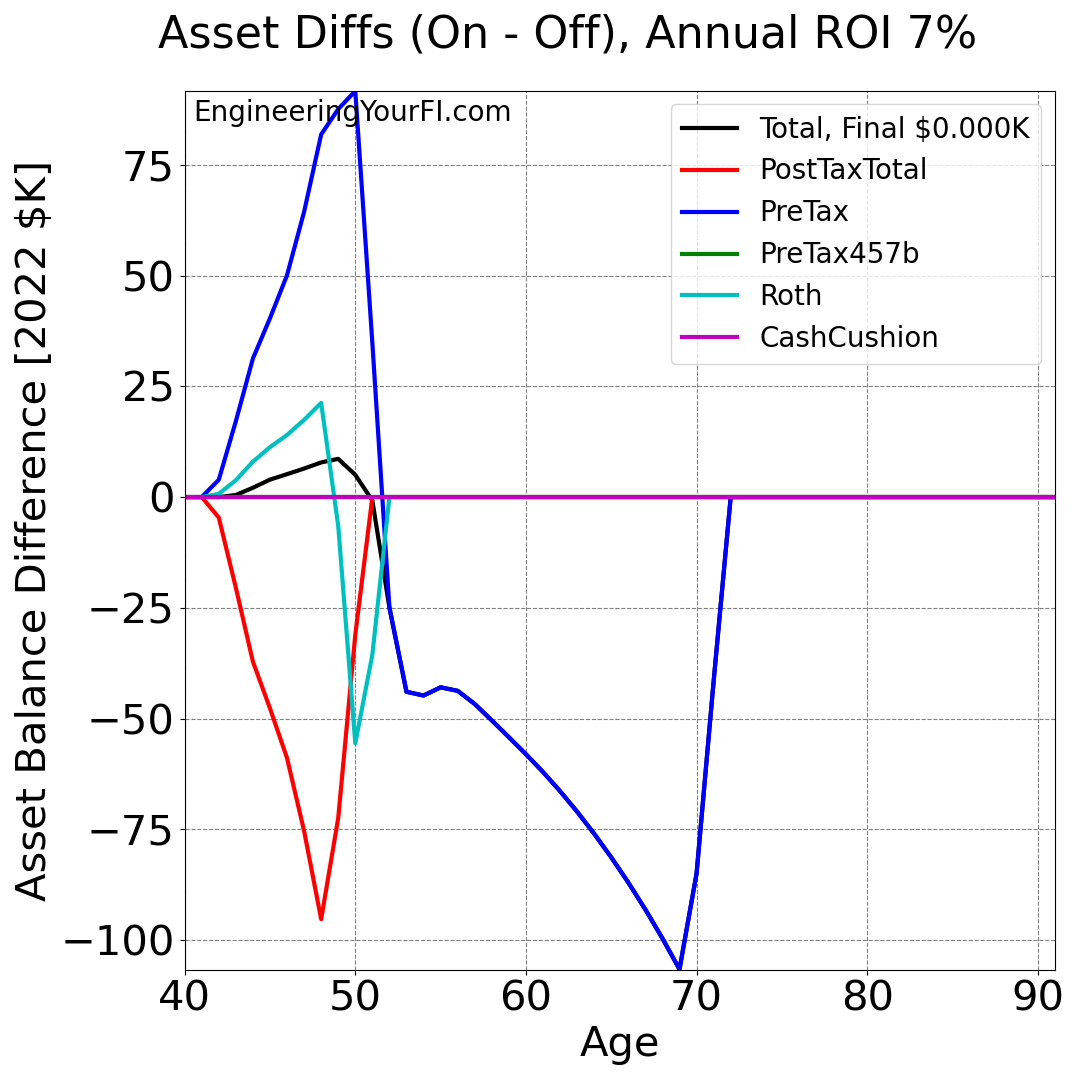
You can see how the PreTax (e.g., Traditional IRA) balance is much higher for the ON scenario when Betty is in her 40’s, and the PostTax (i.e. taxable) balance is much lower for the ON scenario in that same timeframe. That makes sense – the new method shifts withdrawals from PreTax to PostTax, trying to generate more cash, so the PreTax balance should be higher.
And in fact, the new method does appear to produce a higher net worth when she’s in her 40’s! The black Total line is above zero until Betty is 51, which is also around when the PostTax and Roth accounts are depleted for both scenarios and Betty’s entire net worth is in her PreTax account.
Unfortunately, after age 51 the total asset balance sinks and stays well below $0 the rest of the simulation.
Yearly Values
Now why does the total asset balance sink so much? Why isn’t Betty seeing the benefits of avoiding taxes/penalties in her 40’s for the rest of the simulation?
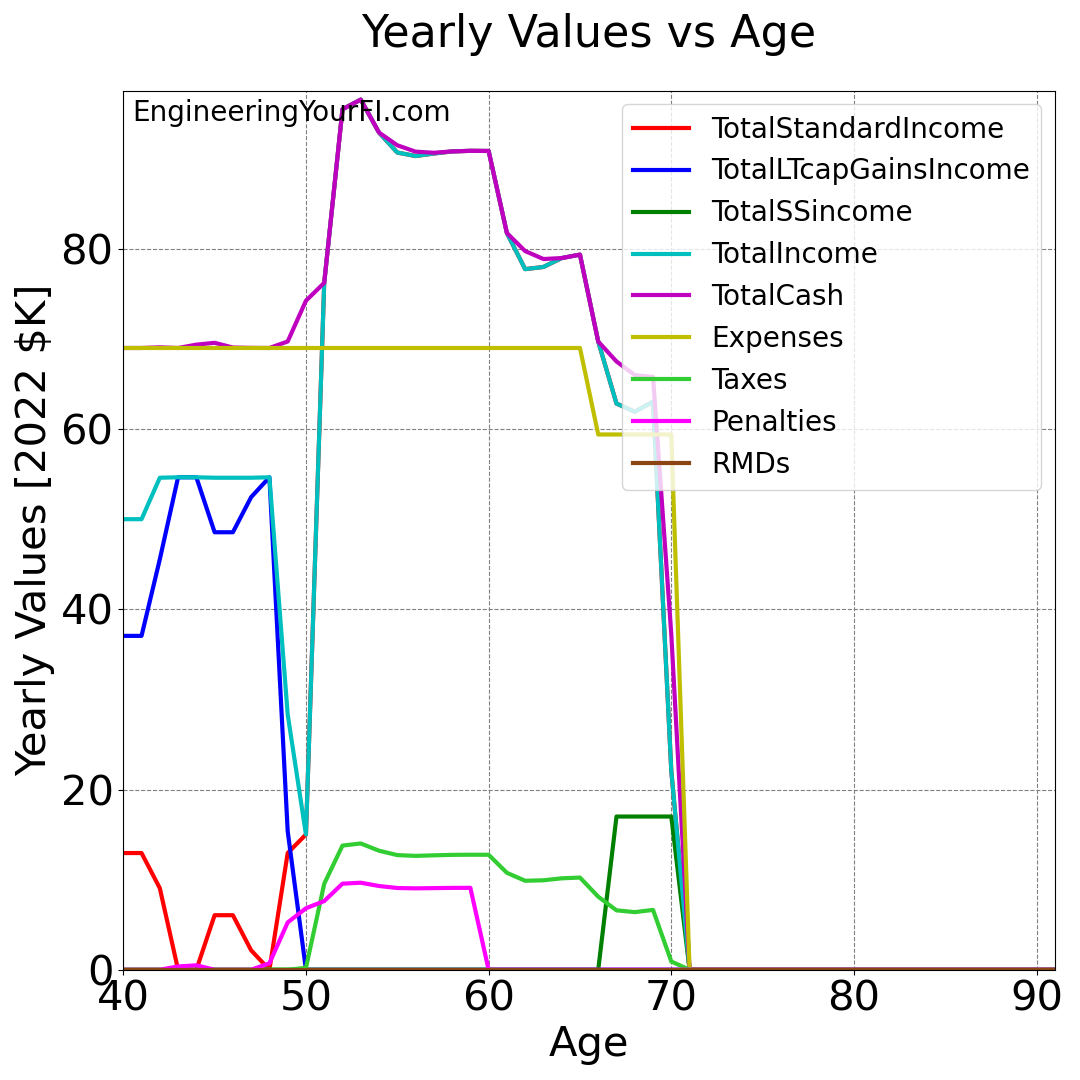
We can find the answer by plotting the yearly values such as income, taxes, and penalties for Betty. To start, let’s look at these values for Betty over time with the new method OFF:
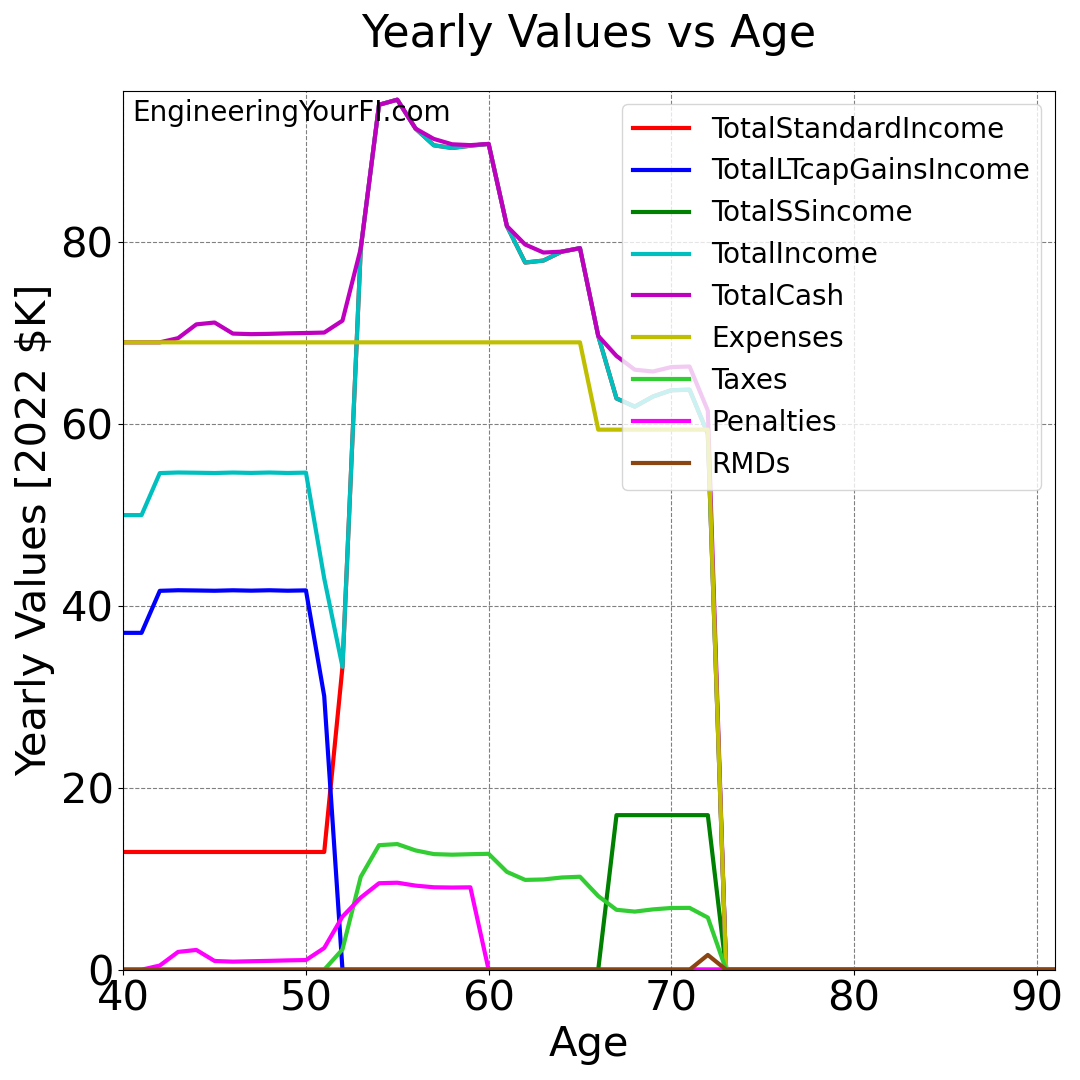
You can see how all lines go to zero at age 72 when she runs out of money (though of course in reality she’ll continue to receive social security income, etc.). Note how penalties start fairly early, in her 40’s, and taxes start in her 50’s.
Now let’s look at these values for Betty over time with the new method ON:
You can see the impact of the new method at ages 42 through 49 – instead of flat lines of constant total standard income and constant LT cap gain income, the total standard income drops (down to zero sometimes) and the LT cap gain income increases by roughly the same amount.
We can see the differences between the two scenarios much better if we actually plot those differences – just like for the asset difference plot above. Thus the scenario values with the new method OFF are subtracted from the scenario values with the new method ON:

You can see the same “equal and opposite” nature of the total standard income and total LT cap gains when Betty is in her 40’s here.
What’s very interesting is that while the penalty value difference is slightly negative during that time (as expected), it becomes strongly positive in her late 40’s – indicating Betty is paying MUCH more in penalties once her PostTax account is depleted with the ON scenario. Taxes are also positive on this plot – thus Betty will pay (much) more in taxes with the ON scenario.
Thus it appears Betty is paying higher OVERALL taxes and penalties through age 53 with the method ON, even if they are a bit smaller initially. And that overall increase is strong enough to make her overall assets lower for most of the simulation.
So while she’ll save money in her 40’s when the method is operating, she’s also digging herself a hole that is much more costly in the end to dig out of.
Why is she digging herself a hole? Two reasons that I can see:
- By converting less from her Traditional IRA to her Roth IRA during her mid-40’s, she has access to much less penalty-free money using the Roth ladder in her late 40’s and early 50’s
- By using up much more of her Taxable account funds during her mid-40’s, she has access to much less tax-free money in her late 40’s and early 50’s
You can see how RMDs are not really a factor, at least in this scenario, because the ON scenario runs out of money before age 72 (and yes, I know I need to add a user input for that age so that folks can specify 73 or 75 depending on their age in 2033).
Also note that the negative values from age 70 to 72 are due simply to the OFF scenario lasting longer than the ON scenario – you can safely ignore those.
Code
If you’d like to plug in your own values and play with different withdrawal scenarios to see if you can find a scenario where this idea proves beneficial, you can download the Python code and run it yourself. And if you do, please let me know!
In past posts I’ve provided an embedded Python interpreter in this Code section that you can run directly in the browser, but the codebase has grown quite a bit, which makes it a bit unwieldy for a simple embedded interpreter interface. But if you’d really like to have that, let me know and I’ll see if I can make it happen.
What’s Next?
While I showed just a single scenario above, I think it’s fairly representative of many different scenarios I looked at. I haven’t found a single scenario where it improves the results. For most scenarios it has no impact, and in the rest it actually produces WORSE results.
Initially I thought about employing this new method in a stress testing analysis that looks at a variety of expenses / expense rates / ROI values like I did previously.
But, given all the scenarios I’ve looked at so far, I strongly suspect that would be a giant waste of time. I think it’s time to cut my losses and move on.
So I think at this point I’m ready to put this idea to bed, with one important exception.
ACA Subsidies
Something very important that I have not yet modeled is the impact of changing your income on your ACA subsidies for health insurance.
Assuming you’re FIRE and thus not working AND not eligible for Medicare, odds are you’ll be getting your health insurance via the Obamacare exchanges.
And if you have Obamacare, the amount of subsidies you receive, and thus how much you pay for health insurance, is heavily dependent on your income – along with number and age of all people on the plan, your zip code, etc.
So that means that if your income rises, your subsidies go down, and your health insurance cost rises. How much? I have no idea. But it’s a non-trivial amount.
Thus if this new withdrawal method can keep your income steady while delivering more cash for expenses, even if it’s digging a financial hole as I described above, that might save you large enough amounts of money in health insurance premiums to make the new method worth it.
Or not. I also wouldn’t be surprised if the impact is not large enough to overcome the weaknesses I discuss above.
To settle this question, I will need to add a model to the simulation tool for ACA subsidies – and I suspect coding that up will not be trivial. Hopefully I’m wrong and it’ll be pretty simple – but I doubt it.
So I’ll keep the door slightly ajar on this new method for now. And as always, if you think you have a situation where this approach/method could actually help, then let me know! I’m happy to look at different scenarios.
Updating FIRE Withdrawal Strategy Algorithms Page
So now that I’ve settled on not employing this new method (unless ACA subsidies somehow redeem it), I feel good about proceeding with a major update of the FIRE Withdrawal Strategy Algorithms page to show the latest formulation I have for the TPM (and Traditional) methods.
I’m also thinking about either adding to that page or creating a new page/post that gives readers a simple step-by-step set of instructions on how to execute the TPM method. Including me in 5 years when I’ve totally forgotten all this!