If you’re focused on FIRE (Financial Independence and Retiring Early), it’s easy to sweep topics like Required Minimum Distributions (RMDs) under the rug. Those don’t start until age 72! That’s decades from now!
But an early retiree is in a unique position to take advantage of decades of tax planning – which means we can hopefully minimize taxes over our ENTIRE LIFE, including the span when we’re forced to take RMDs.
But before we dive into how to minimize lifetime taxes that includes RMDs for an early retiree, we need a good understanding of what they are and how they work.
RMD Algorithm
Computing RMDs is pretty easy actually: find the distribution period for your age on December 31 each year from the published IRS table, and divide any assets you have in “pre-tax” accounts (e.g. 401K, 403(b), 457(b), Traditional IRA) at the end of that year by that distribution period.
E.g., if you’re 72 and have a total of $1M in your 401K and Traditional IRA, you’ll have to withdraw $1M / 27.4 = $36496.35 from your accounts that year (and fortunately it doesn’t matter which pre-tax accounts you withdraw from, as long the total is correct).
How does the IRS come up with these “distribution periods”? Well the nicely morbid answer is these are based on how much longer you’ll probably be alive (otherwise known as actuarial tables). Hence the term “life expectancy factor” you’ll find in the official IRS documents. Thus as you get older, and your life expectancy shrinks, the RMD withdrawal rate goes up.
So if you’re 72, the withdrawal rate is 1/27.4 = 3.6%, while someone aged 100 faces a withdrawal rate of 1/6.4 = 15.6%. And if you somehow match the lifespan of the oldest person to ever live, you’ll face a withdrawal rate of 50% every year beyond 120!
If you forget to withdraw your RMD, there’s a HEFTY penalty: 50% on the amount you should have withdrawn. Ouch! So don’t forget. Though there are some steps you can take to avoid the penalty if you do forget, which essentially involves begging for forgiveness from the IRS.
Note: I am using the most common “Uniform Lifetime” table (Table III) in this article, assuming you don’t have a spouse (who is the sole beneficiary of your pre-tax accounts) more than 10 years younger than you, and that you aren’t a child beneficiary instead of the original account holder. If either of those assumptions are false for you, see Table I (if you are a beneficiary) or Table II (your spouse is the sole beneficiary and more than 10 years younger than you).
Here’s the 2022 Uniform Lifetime Table in all it’s glory:
| Age | Distribution Period (Years) | Age | Distribution Period (Years) |
| 72 | 27.4 | 97 | 7.8 |
| 73 | 26.5 | 98 | 7.3 |
| 74 | 25.5 | 99 | 6.8 |
| 75 | 24.6 | 100 | 6.4 |
| 76 | 23.7 | 101 | 6 |
| 77 | 22.9 | 102 | 5.6 |
| 78 | 22 | 103 | 5.2 |
| 79 | 21.1 | 104 | 4.9 |
| 80 | 20.2 | 105 | 4.6 |
| 81 | 19.4 | 106 | 4.3 |
| 82 | 18.5 | 107 | 4.1 |
| 83 | 17.7 | 108 | 3.9 |
| 84 | 16.8 | 109 | 3.7 |
| 85 | 16 | 110 | 3.5 |
| 86 | 15.2 | 111 | 3.4 |
| 87 | 14.4 | 112 | 3.3 |
| 88 | 13.7 | 113 | 3.1 |
| 89 | 12.9 | 114 | 3 |
| 90 | 12.2 | 115 | 2.9 |
| 91 | 11.5 | 116 | 2.8 |
| 92 | 10.8 | 117 | 2.7 |
| 93 | 10.1 | 118 | 2.5 |
| 94 | 9.5 | 119 | 2.3 |
| 95 | 8.9 | 120+ | 2 |
| 96 | 8.4 |
You can invert these distribution period values to get the required withdrawal rate at each age. Here’s a plot of those rates from ages 72 to 92 (well past the average life expectancy of even the longest lived countries):
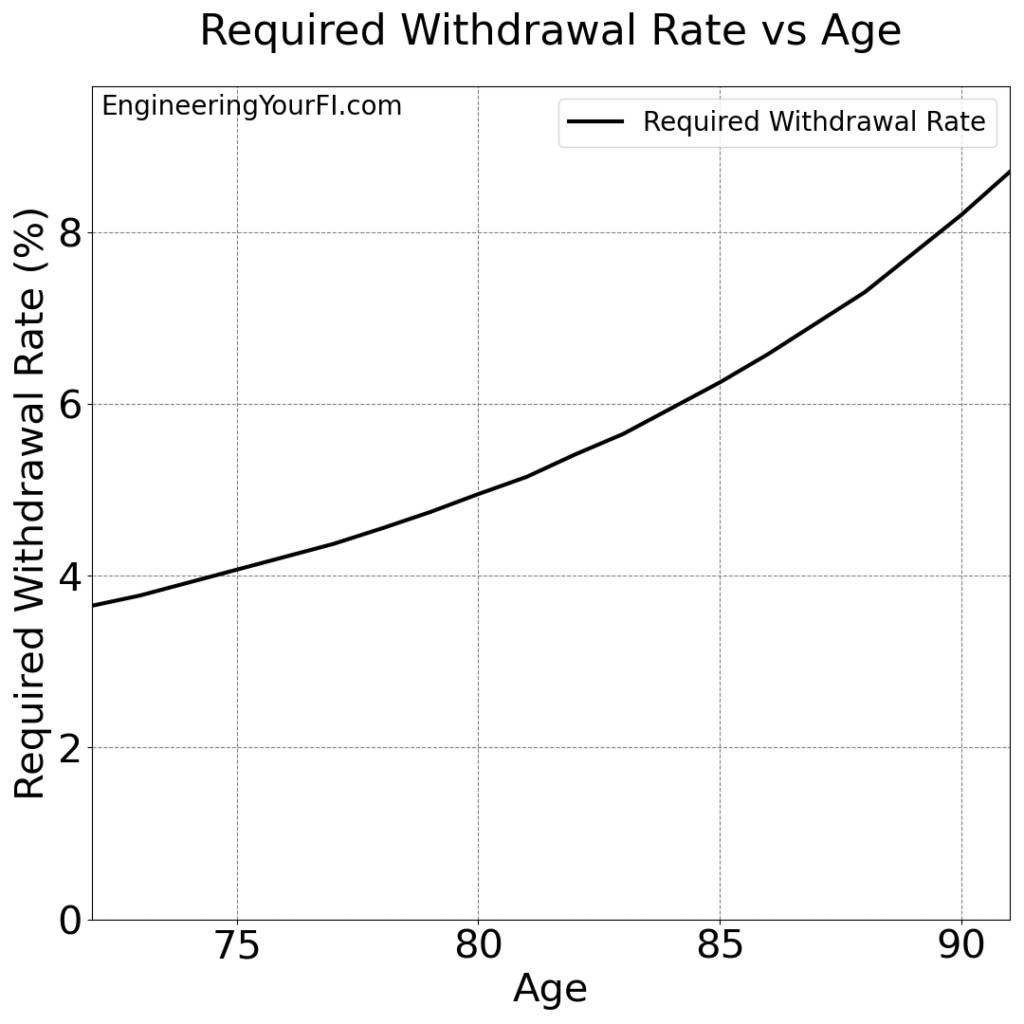
You can see how it starts a bit under 4%, and grows to over 8% by the time you enter your 90’s.
Example Scenarios
Alrighty, let’s discuss some concrete examples to see the impact of these RMDs.
Anne’s Filing Status: Single
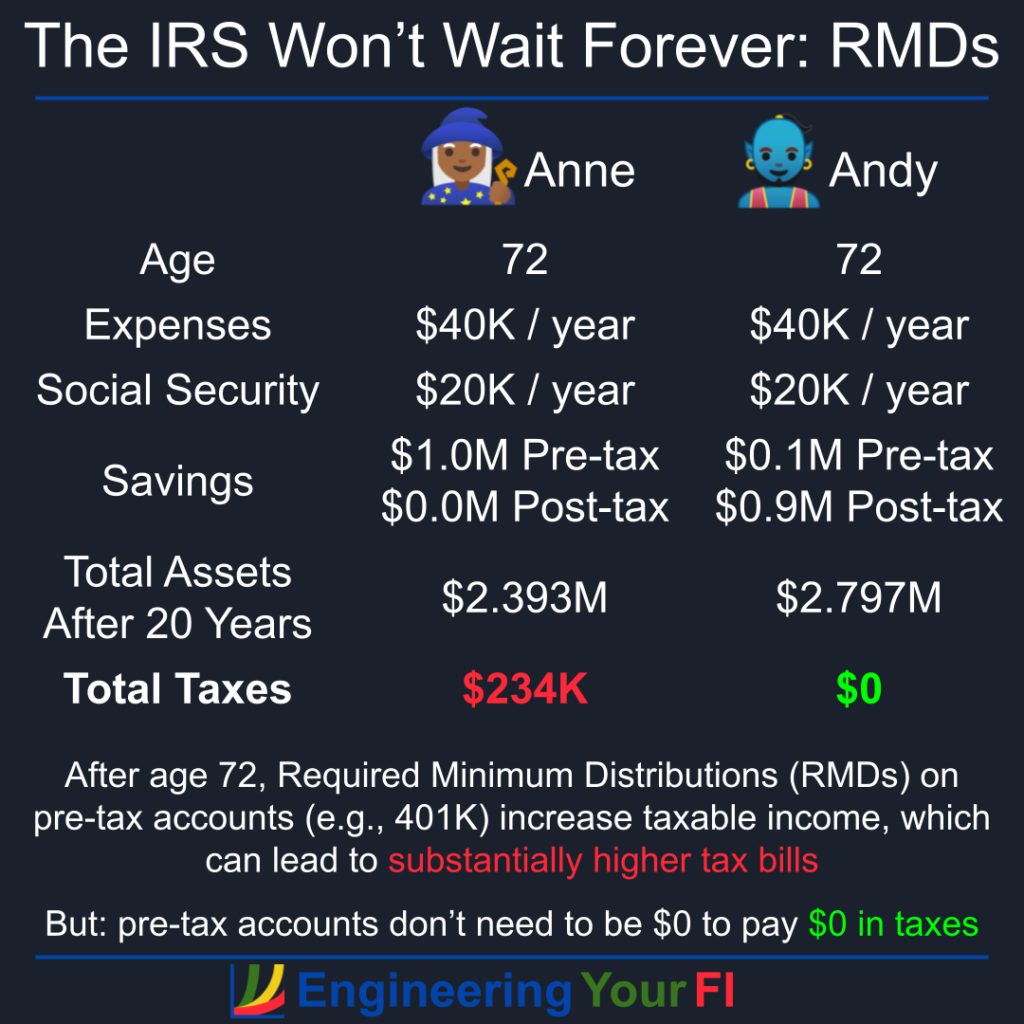
Anne is 72 years old, has $40K in expenses each year, has a social security income (which the Social Security Administration refers to as retirement insurance benefits (RIB)) of $20K per year, and has $1M entirely in a pre-tax account such as a 401K or Traditional IRA. (I recognize this is somewhat unrealistic, as likely no one will have ALL their money in a pre-tax account, but we’re aiming for simplicity in this example.) We’ll also assume a 7% after-inflation ROI each year for the assets in the pre-tax account. I also have Anne in the diagram at the top of this post.
For each year, Anne will withdraw the required RMD from the pre-tax account, use that withdrawal to pay for any expenses not covered by RIB, then move any remaining funds into a “post-tax” (i.e. taxable) brokerage account.
Running a twenty year simulation, we can see the balance of her pre-tax and post-tax accounts over time (in current year dollars):
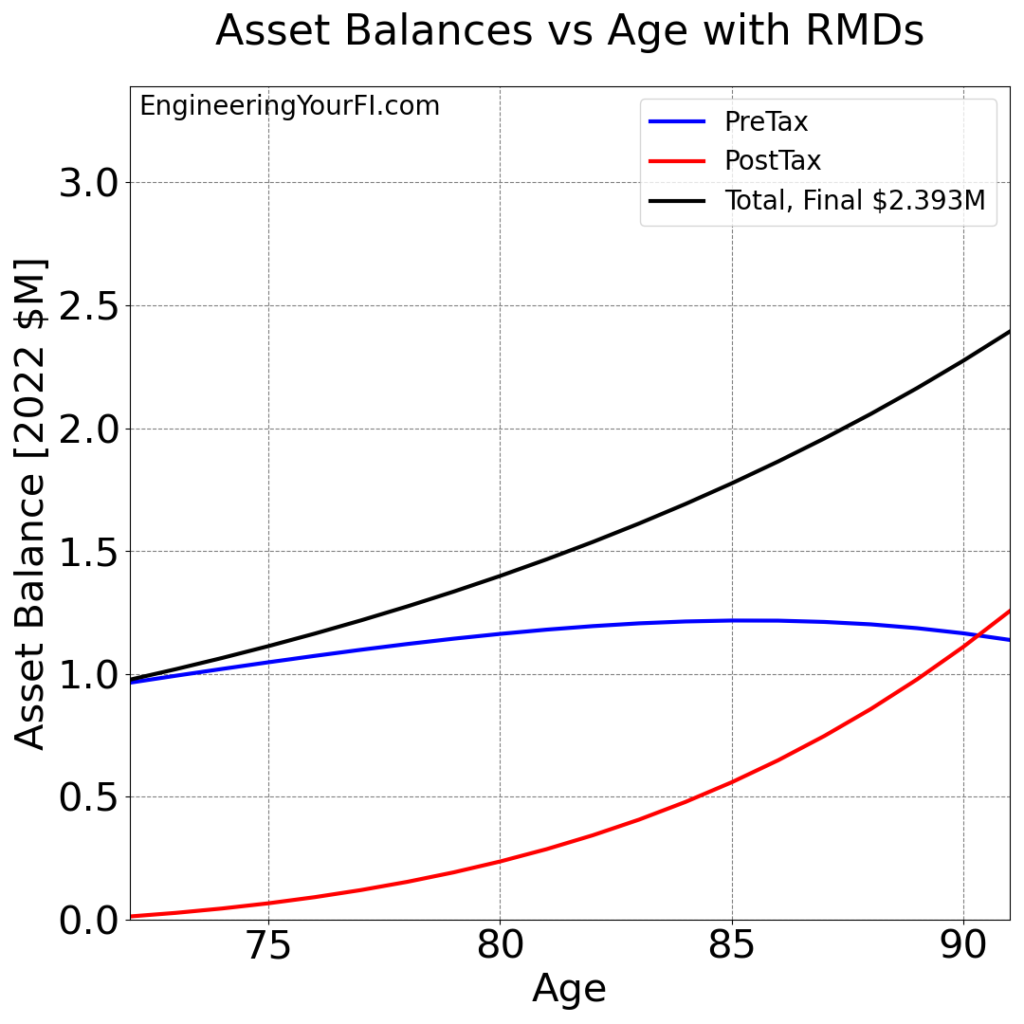
In this scenario, the post-tax account overlaps the pre-tax account around age 90, and the final total reaches $2.393M – not bad for Anne! She also pays about $234K in taxes over those twenty years – ouch.
Anne has a friend Andy, who is also single and 72, also has $20K in RIB, also has $40K in annual expenses, and also starts with $1M in his investment account. BUT, his $1M is in a post-tax (i.e. brokerage or taxable) account instead of a pre-tax account.
So Andy has no RMDs, and thus no taxes resulting from RMDs. As a result, Andy end up with $2.797M after 20 years, about $404K higher (17%) than Anne.
This $404K difference gives you a sense of the impact you can have on your final balance by moving funds from pre-tax accounts to post-tax or Roth accounts via the long tax planning phase a FIRE person has.
Out of curiosity, I also thought I’d take a look at how the RMDs and resulting taxes for Anne evolved during the simulation:
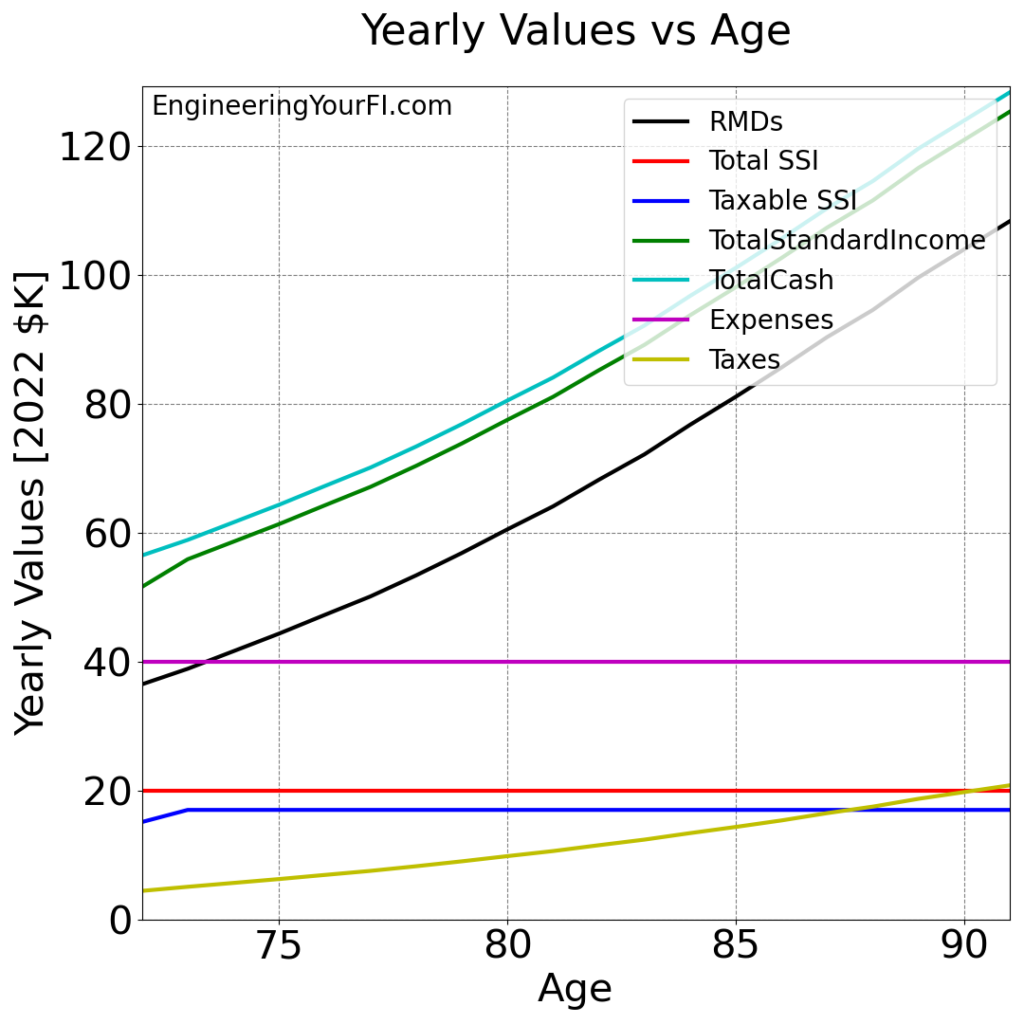
You can see how the RMDs increase over time, with a very slight curve to the plot as well (vs just a linear straight line) – indicating very slight exponential growth (but nothing to write home about).
The yellow Taxes line is pretty dang linear though, and eventually surpassed 20% by the time she was 90 years old.
At this point you might be thinking, “Yeah, sure, it’d be great to shift ALL my pre-tax funds to post-tax / Roth before I turn 72. But c’mon, that’s not likely to happen even with decades of tax planning.”
Good point. And of course you should be maxing out your pre-tax accounts while working, so it’s going to be tough to avoid a large pre-tax account balance at 72.
So let’s take a look at how the percentage of your assets in pre-tax vs post-tax accounts impacts your final asset balance. If we take this same scenario and shift the assets from 0% in pre-tax to 100% in pre-tax:
Excellent, we see the same final balances for 0% pre-tax ($2.797M) and 100% pre-tax ($2.393M) discussed above. But a very interesting twist is that this plot is essentially flat until the portfolio is about 20% pre-tax! That means you don’t have to get to 0% pre-tax to achieve the maximum final total – something around 20% or less will get the same result.
Why is the plot flat in the beginning? As usually, the answer comes back to taxes:
Taxes are in fact zero until the pre-tax initial value is $120K (12% on the above plot), explaining why the above final balance was also flat until that same point. The $0 tax bill is due to the (relatively) low balance in the pre-tax account, which results in low RMDs, which means lower taxable RIB, and thus standard income that’s below the standard deduction. Neat!
What about RMDs as a function of the pre-tax percentage though? Do those exhibit any unexpected behaviors? Well, no:
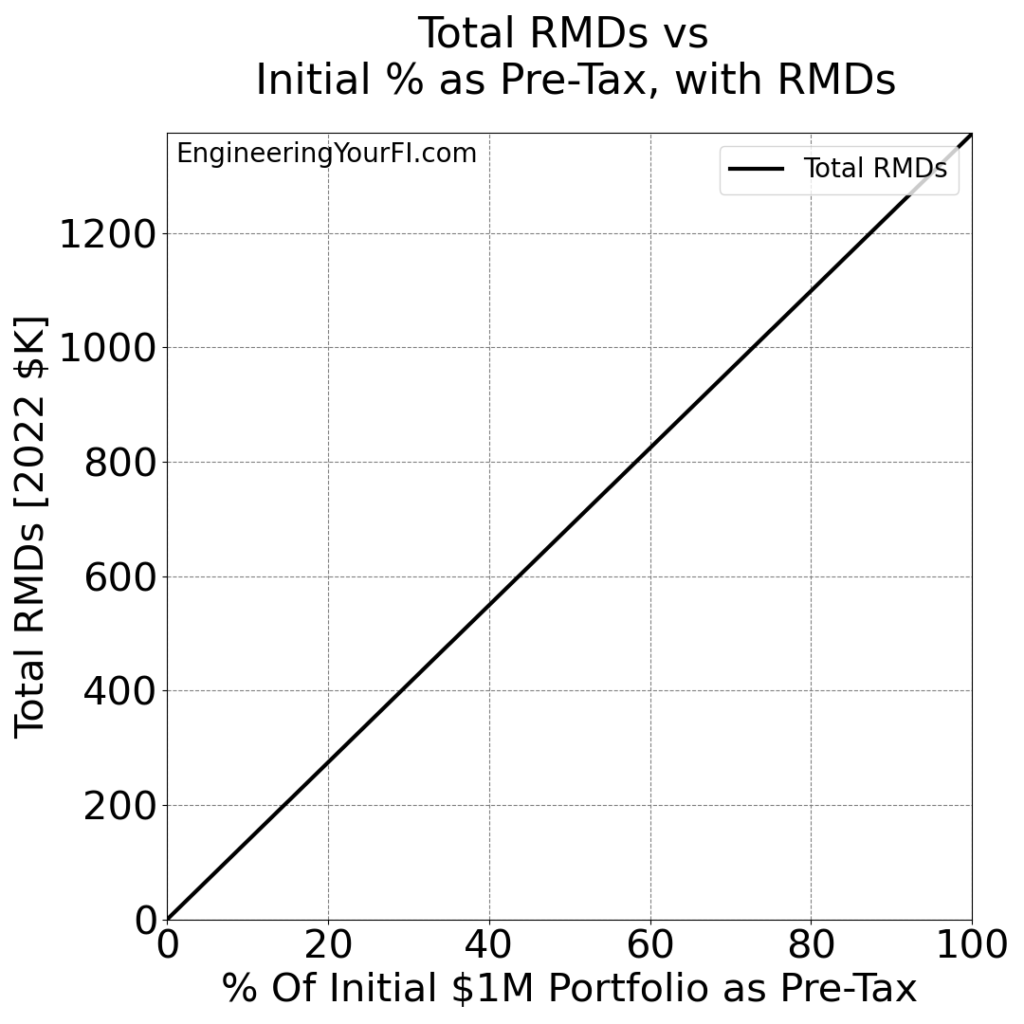
As you can see, we have an extremely straight line for RMDs – which makes sense, as the RMD is directly computed as the amount in the pre-tax account divided by the distribution period from the above table.
Tim’s Filing Status: Married Filing Jointly
Now let’s take a look at a similar scenario for a married couple. Tim and his spouse are both 72 years old, have a total of $40K in expenses each year, and have $1M entirely in a pre-tax account such as a 401K or Traditional IRA. The only difference from the above scenario with Anne is that Tim and his spouse earn double the RIB: $40K/year.
Running a twenty year simulation, we can see Tim’s post-tax account overtakes the pre-tax account around age 86 and the total final is $3.308M:
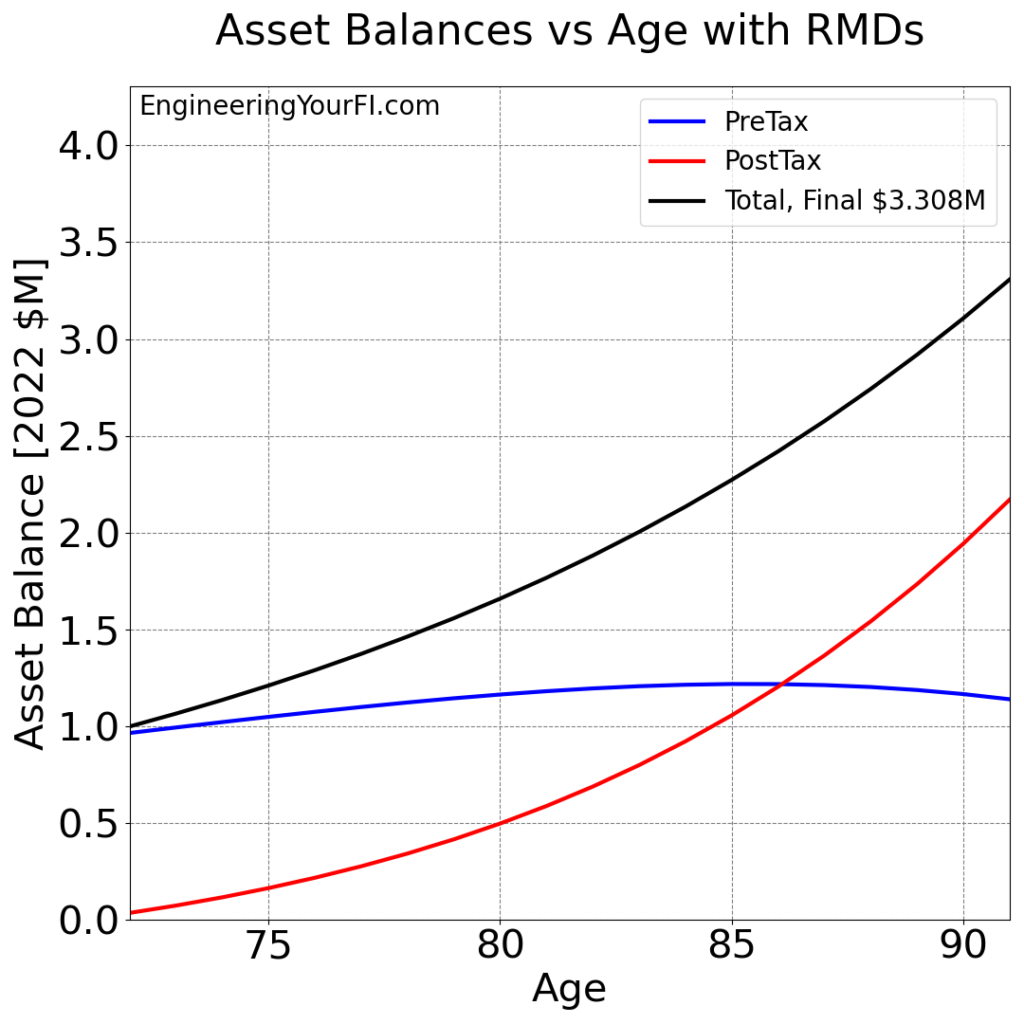
The total final is quite a bit higher than Anne’s total final of $2.393M, due to having double RIB and a much higher standard deduction for the married filing jointly status.
What’s interesting is that the final pre-tax value ($1.138M) for the single vs married scenarios is IDENTICAL – it’s the final post-tax balance ($2.170M married, $1.255M single) that makes all the difference. Why?
It’s because the RMD required withdrawal from the pre-tax account each year is the same for both scenarios – both the single person and couple start with the same total amount of pre-tax money ($1M). After that withdrawal, the couple has more RIB and a higher deduction (reducing taxes) than the single person, but those factors impact the post-tax balance, not the pre-tax balance.
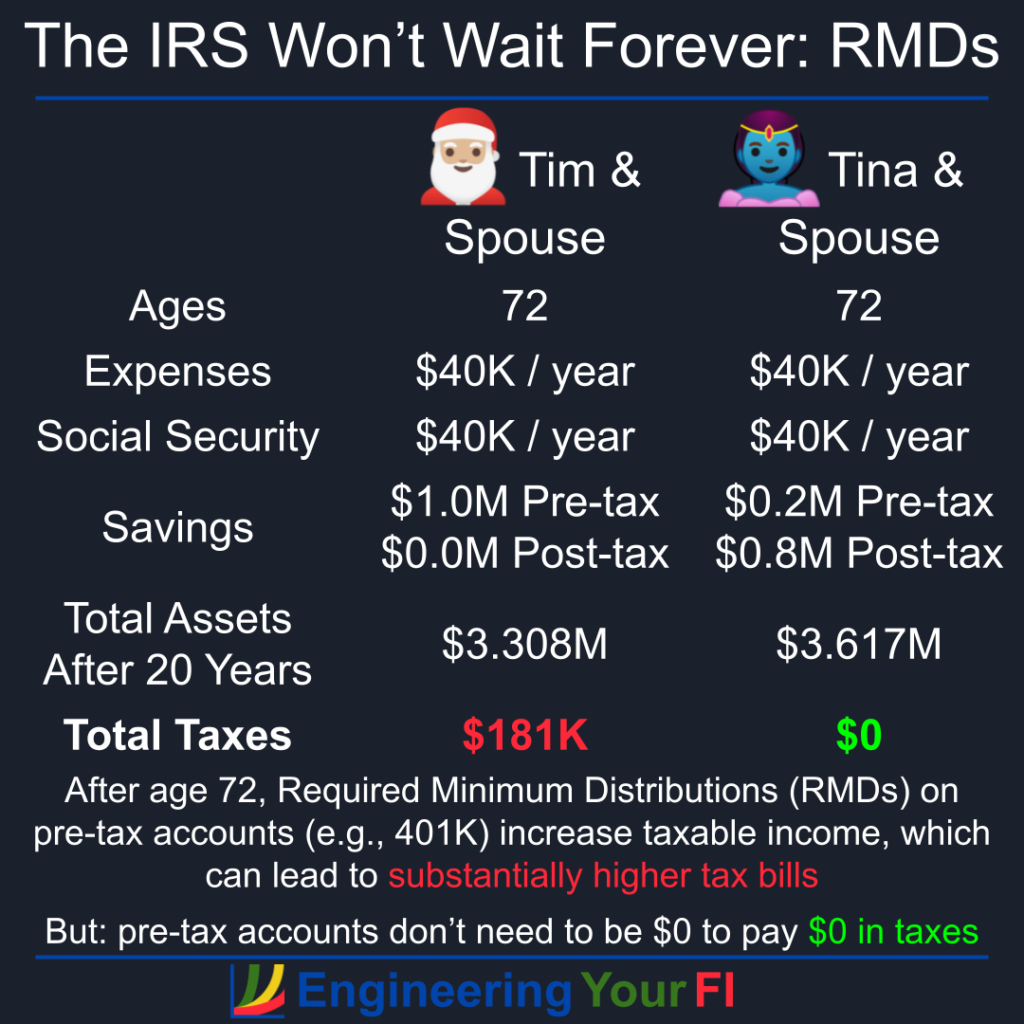
Like Anne’s friend Andy, Tim has a friend named Tina with the same financial situation as Tim except that all $1M savings are in a post-tax account (so no RMDs). After twenty years, Tina and her spouse end up with $3.617M – about $309K (9.3%) higher than the $3.308M Tim and his spouse have. Interestingly the difference between Tim and Tina is less pronounced than Anne vs Andy (which has a $404K, 17% different final balance).
Getting back to Tim and his spouse, let’s check out the RMDs and taxes they will pay over twenty years:
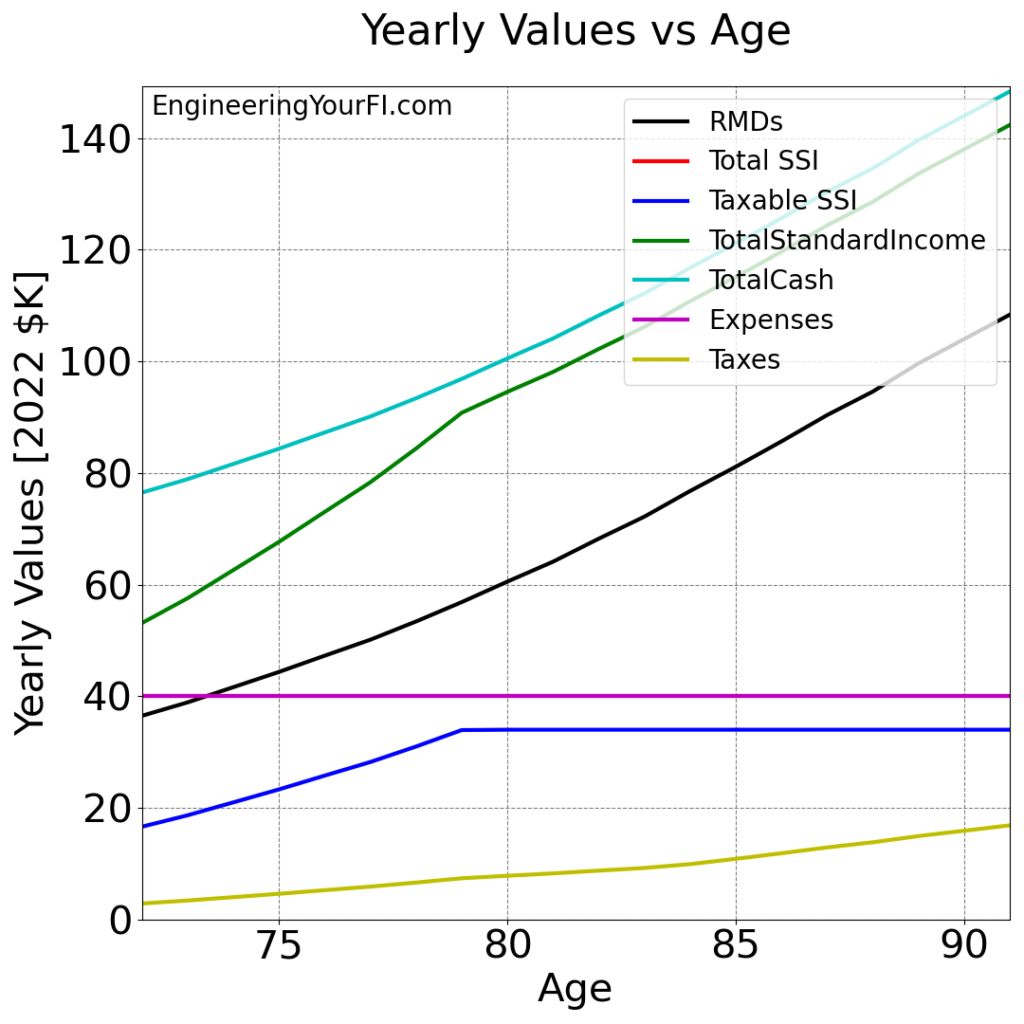
We can see the RMDs match Anne’s (single status) scenario above, but taxes are lower due to the higher standard deduction for a married couple: totaling $181K over twenty years, vs $234K for Anne.
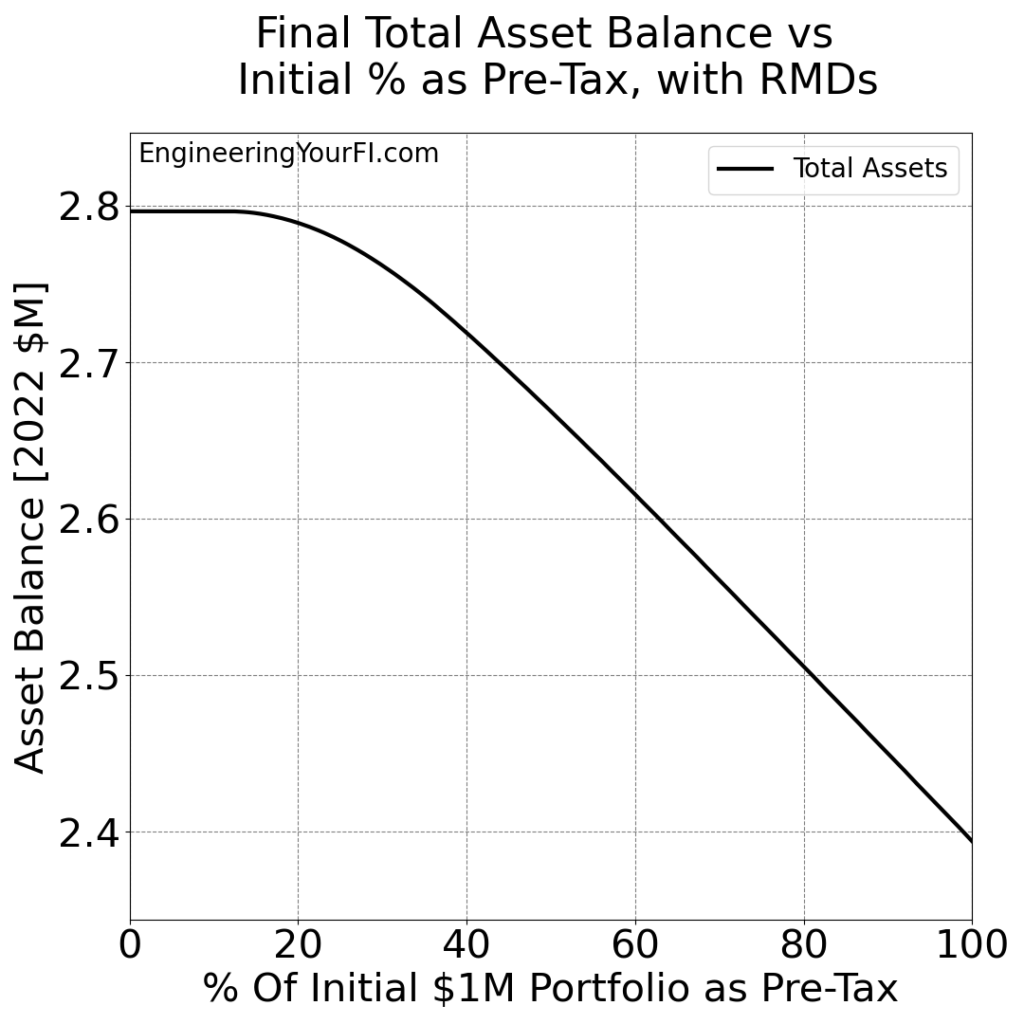
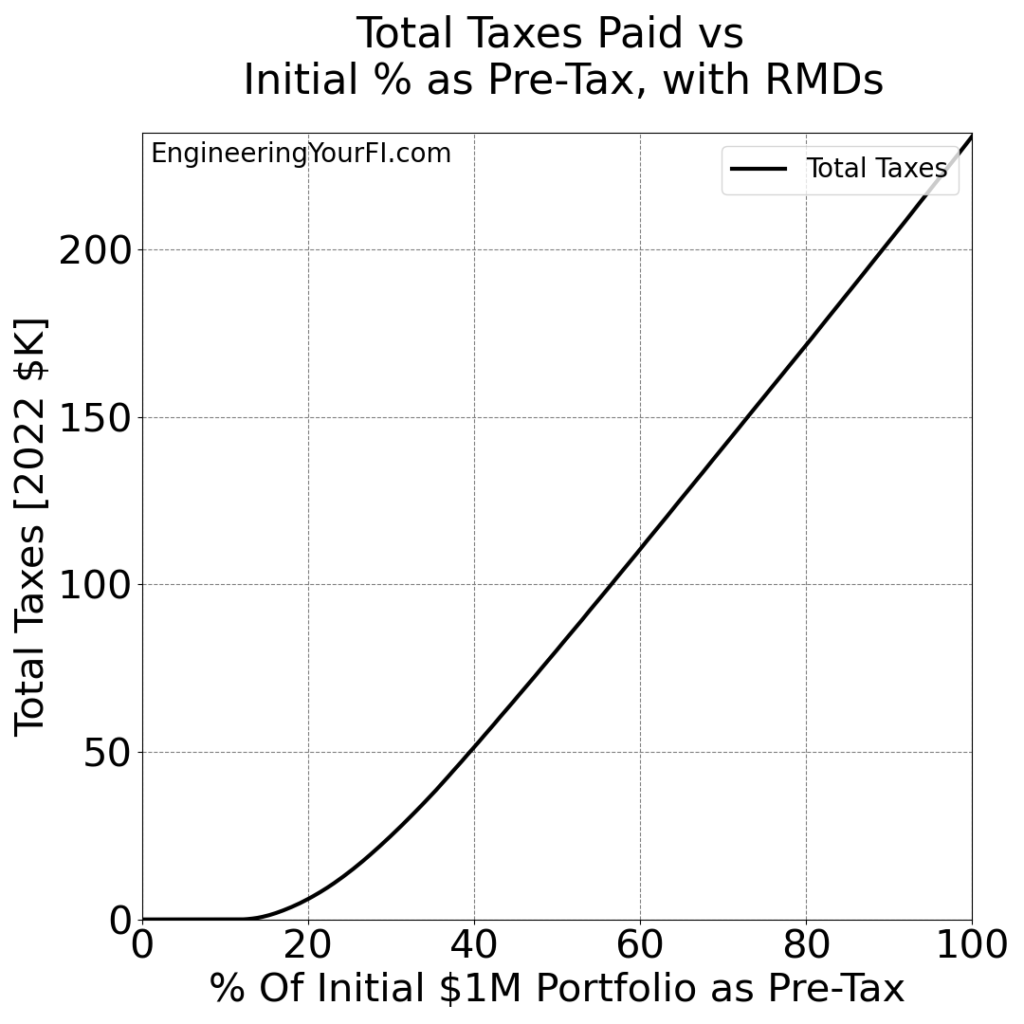
Finally, we can take a look at plots of total final balance and total taxes versus percentage of initial balance in a pre-tax account, equivalent the plots shown above for Anne:
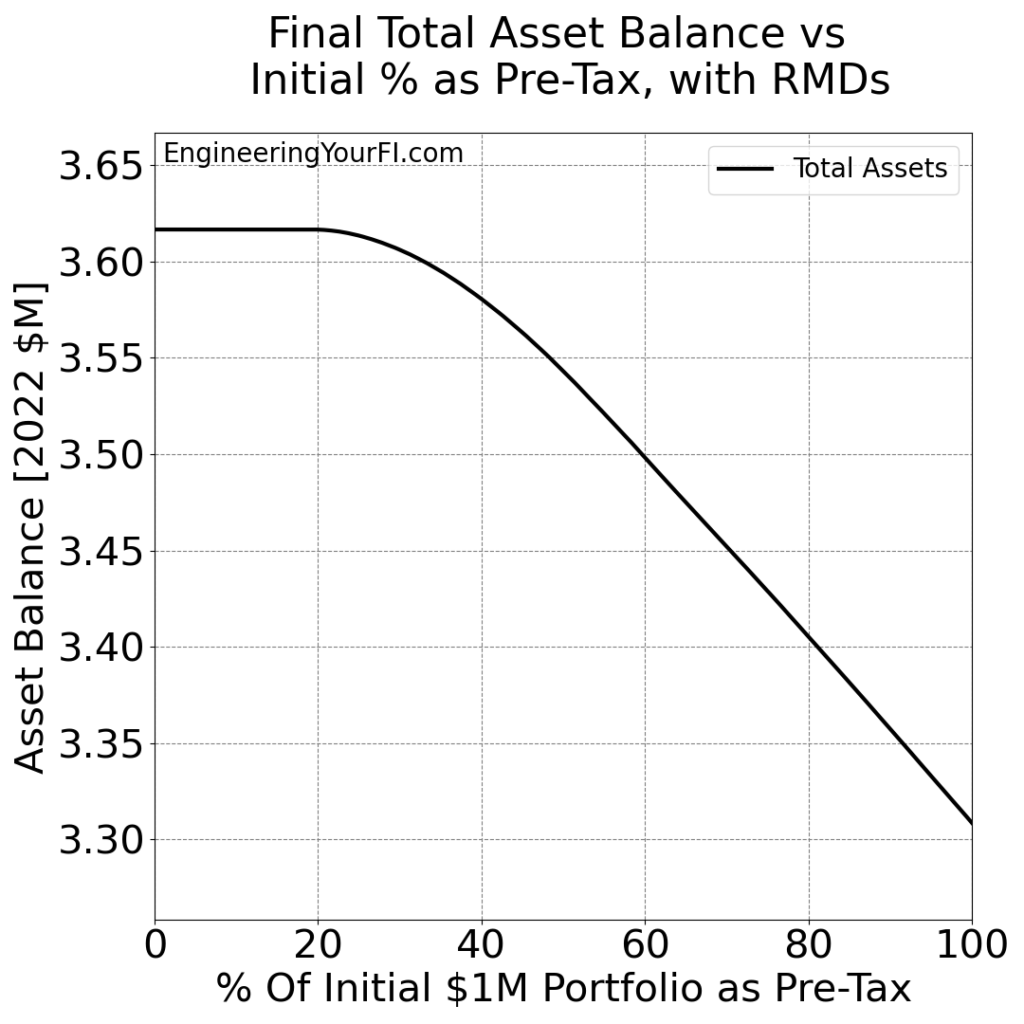
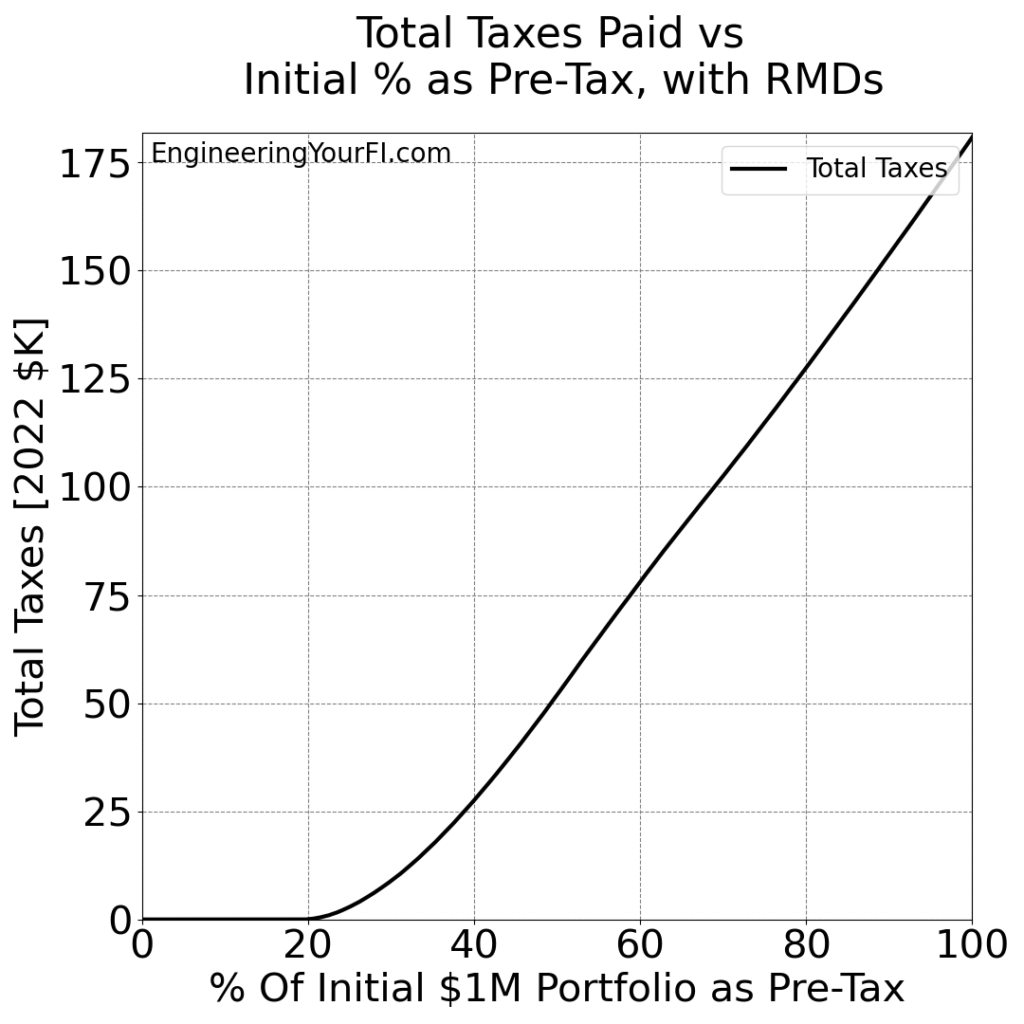
Similar to Anne’s scenario, the Total Assets line and the Total Taxes lines are flat until $197K. So if you’re filing your taxes as married filing jointly like Tim and his spouse, earn $40K in RIB, and up to 20% of your $1M savings is in a pre-tax account, RMDs will have a negligible impact on your final total.
A diagram of this example:
Code
If you’d like to plug in your own values to the tool I built for computing RMDs and creating the above plots, you can download the code or modify and run the embedded Python interpreter below.
You can also of course tweak the code itself to your heart’s content. Especially if you’d prefer to change the look of the plots for any reason.
Modify the user inputs section at the top as desired, then hit the Run/Play (sideways triangle) button to generate the plots. To go back to the script to make any changes, hit the Pencil icon. If you want the text larger, hit the hamburger menu button, then scroll to the bottom to see larger font options. In that same menu you can also Full Screen the window, and other actions.
Future Work
The above plots and example scenarios show the impact of shifting money from pre-tax accounts to post-tax accounts on your RMDs, and thus your tax bill.
The main next question in my mind: instead of striving for a $0 tax bill until age 72 (as I showed in the Tax and Penalty Minimization method), does reducing your pre-tax account balance in order to reduce RMDs after age 72 make it worth incurring a small amount of taxes (e.g. the lowest tax bracket) earlier in life?
That’s the question I plan to tackle next, and I’m very excited to figure that out.
Conclusions
Required Minimum Distributions (RMDs) are not something the FIRE crowd discusses very often, but they can result in pretty significant taxes when you’re older. It’s definitely not a reason to do anything other than max out your pre-tax accounts while you’re working, but it might impact your withdrawal strategy after retirement. At the very least, it’s important to understand how they are computed and why they are so important to remember doing, so that you’re not caught flat footed later in life and stuck with a crazy 50% penalty (or begging forgiveness from the IRS).