Last Updated: March 7, 2022
In the previous post, I discussed how to compute the taxable amount of your social security income, which the Social Security Administration refers to as retirement insurance benefits (RIB). Which is unfortunately a bit complicated, but we got it done.
The next step is to figure out how to pay no (or minimal) taxes on that taxable amount of your social security, which is vital for the Tax and Penalty Minimization (TPM) method described in the Withdrawing Money After FIRE post.
You’re probably thinking “uh… doesn’t the definition of taxable mean you’ll pay taxes on it?”
That’s where the beautiful standard deduction comes in. As long as your taxable RIB is less than or equal to the standard deduction, you’ll pay no taxes on it. Similarly if your taxable SS remains within the lowest tax bracket, you can ensure you won’t pay more than the lowest tax rate.
But how do you ensure the taxable RIB stays within these limits? That question is the topic of this post.
Targeting Total Standard Income and Long Term Cap Gains
Your total standard income includes all non-RIB standard income (including non-qualified dividends, retirement account withdrawals or conversions, earned income, etc.) plus your taxable RIB.
And as discussed in the previous post, your taxable RIB is a function of four things:
- RIB
- non-RIB standard income
- long term capital gains and qualified dividends (which I’ll collectively refer to as LT cap gains, as they are taxed at the same rate)
- tax filing status (married filing jointly vs all other filing statuses)
So as discussed in the FIRE Withdrawal Strategy Algorithms page, what we want to do is target a specific amount of non-RIB standard income and LT cap gains that gives a taxable RIB that fits into these equations:
- taxable RIB + non-RIB standard income = standard deduction (or top of lowest tax bracket if you prefer, but I’ll be shooting for the standard deduction in the rest of the article)
- taxable RIB + non-RIB standard income + LT cap gains = top of 0% LT cap gains tax bracket
By doing this targeting as part of the TPM method, you can significantly reduce your tax bill, hopefully down to $0. Those lower tax bills can result in tremendous gains over many years with compounding growth.
Targeting Algorithm
NOTE: After considering the impacts of large RMDs, I updated the below algorithm on the FIRE Withdrawal Strategy Algorithms page. See that page for the latest version.
The following is a high level description of the targeting algorithm that I implemented in python, to provide a general sense of how it works. For more details, please see the code itself.
Targets
As mentioned above, we want the maximum standard income (taxable RIB + non-RIB standard income) to equal the standard deduction for your filing status (e.g., $12,950 for single filers, $19,400 for heads of households, $25,900 for married couples filing jointly), so you won’t pay income tax on any of that income.
We also want LT cap gains such that when you add those gains to the max standard income we reach the top of the 0% LT cap gains tax bracket (e.g., $41,675 for single filers, $55,800 for heads of households, $83,350 for married couples filing jointly), so you won’t pay any LT cap gains taxes.
Finally, adjust the maximum standard income you’re shooting for by subtracting any nonqualified dividends and other sources of income you can’t easily dial up and down (e.g. a pension). We’ll call this “remaining standing income room”.
Solve for Max Non-RIB Standard Income
Now that we have our targets, next we need to solve for the max non-RIB standard income. This value, when added to taxable RIB, should equal the above “remaining standing income room”.
The challenge we immediately encounter is that it doesn’t appear possible/practical to manipulate the equations to directly solve for the appropriate max non-RIB standard income (let me know in the comments if I’m wrong). Why? Because taxable RIB is also a function of the non-RIB standard income, and thus any changes to non-RIB standard income also affect the taxable RIB (nominally).
So how do we deal with this stickiness? When I see a situation like this, I typically reach for a numerical solver, which can use well-established numerical optimization methods to converge on the desired solution. In fact, even if I believe it might be possible to eventually suss out a direct analytical solution, I will often save the time and effort and just employ a numerical solver – especially if there’s no reason to believe the underlying functions will take a lot of computation.
The numerical solver we’ll employ is the highly optimized scipy.optimize.newton routine, which employs the Secant method to solve for the appropriate max non-RIB standard income. The goal of the Secant method (or Newton’s method) is to find the point where a provided function is equal to zero. So we need to structure our function so that when we have the desired answer, the “zero function” returns zero.
So if our “remaining standing income room” = max non-RIB standard income + taxable RIB, and taxable RIB is a function (f) of max non-RIB standard income, RIB, and LT cap gains, we need to rearrange this equation to equal zero. So:
max non-RIB standard income + f(max non-RIB standard income, RIB, LT cap gains) – “remaining standing income room” = 0
That’s the zero function we’ll use with scipy.optimize.newton, to solve for the appropriate max non-RIB standard income.
One last thing the numerical method needs: a good starting point. Otherwise it might not converge on the correct result, if it’s starting in a totally wrong region. The starting point we’ll use for the max non-RIB standard income is simply the “remaining standing income room”.
After we run scipy.optimize.newton to solve for the max non-RIB standard income, we can easily directly compute the taxable RIB as the “remaining standing income room” minus the max non-RIB standard income solution.
Solve for Max LT Cap Gains
If all goes smoothly in the previous section, your taxable RIB will be less than the “remaining standing income room”, and the balance will be the max non-RIB standard income.
In that situation, the maximum LT cap gains targeted is unchanged – when added to the total standard income, it will exactly equal the top of the 0% LT cap gains tax bracket. Easy.
BUT, what if your RIB is large enough that the taxable RIB is greater than the “remaining standing income room”? Even if non-RIB standard income is zero?
Well at that point you’ve got to reduce your LT cap gains, so that taxable RIB does not exceed “remaining standing income room”. The question then is how to compute the maximum LT cap gains you can have while keeping taxable RIB at that “remaining standing income room” value.
After verifying that it is possible to get the taxable RIB less than or equal to the “remaining standing income room” value by setting all other income to zero, we’ll employ the same Secant method via the highly optimized scipy.optimize.newton routine as above, solving for the appropriate max LT cap gains.
As in the previous section, we’ll need a reasonable initial guess at the final max LT cap gains solution for the numerical solver to start in the correct region. Unlike in the previous section, I found I needed a stronger initial solution for this part of the algorithm. So for every $1K increment of LT cap gains values from $0 to $100K, I compute the taxable RIB. The LT cap gains value that is closest to the “remaining standing income room” I select as the first guess for the numerical solver.
There is one caveat to this initial solution method though: if the taxable RIB has reached the maximum 85% of RIB, then that won’t work as an initial guess. Why? Because the function is essentially “flat” at that point: no matter how high the LT cap gain value is, the taxable RIB will remain the same. Numerical solvers work by using the gradients of the function to find a single distinct answer, so a completely flat line eliminates the ability of the solver to know which way to go to find the answer. Thus any LT cap gain value that produces the maximum 85% of RIB value is ignored for this initial guess process.
The “zero function” we’ll use with scipy.optimize.newton, to solve for the appropriate max LT cap gains, is even simpler than the previous section:
f(RIB, LT cap gains) – “remaining standing income room” = 0
where the function (f) is the taxable RIB.
Once the solver finds the appropriate max LT cap gains, and thus taxable RIB equals “remaining standing income room”, we also set the max non-RIB standard income to zero.
Plots
Alrighty, now that we’ve laid out the algorithm, let’s see what it produces. And build up some intuition about how the algorithm is working.
If you know your filing status and RIB value, you can look at these plots to see the maximum non-RIB standard income and LT cap gains you can have without paying taxes on any of these income sources.
Filing Status: Single, Head of Household, Married Filing Separately, or Qualified Widow(er)
First up, let’s look at plots for the single, head of household, married filing separately, or qualified widow(er) tax filing status.
If we plot the taxable RIB, maximum non-RIB standard income, and maximum LT cap gains versus RIB for RIB values ranging from $0 to $50K, we get the following figure:
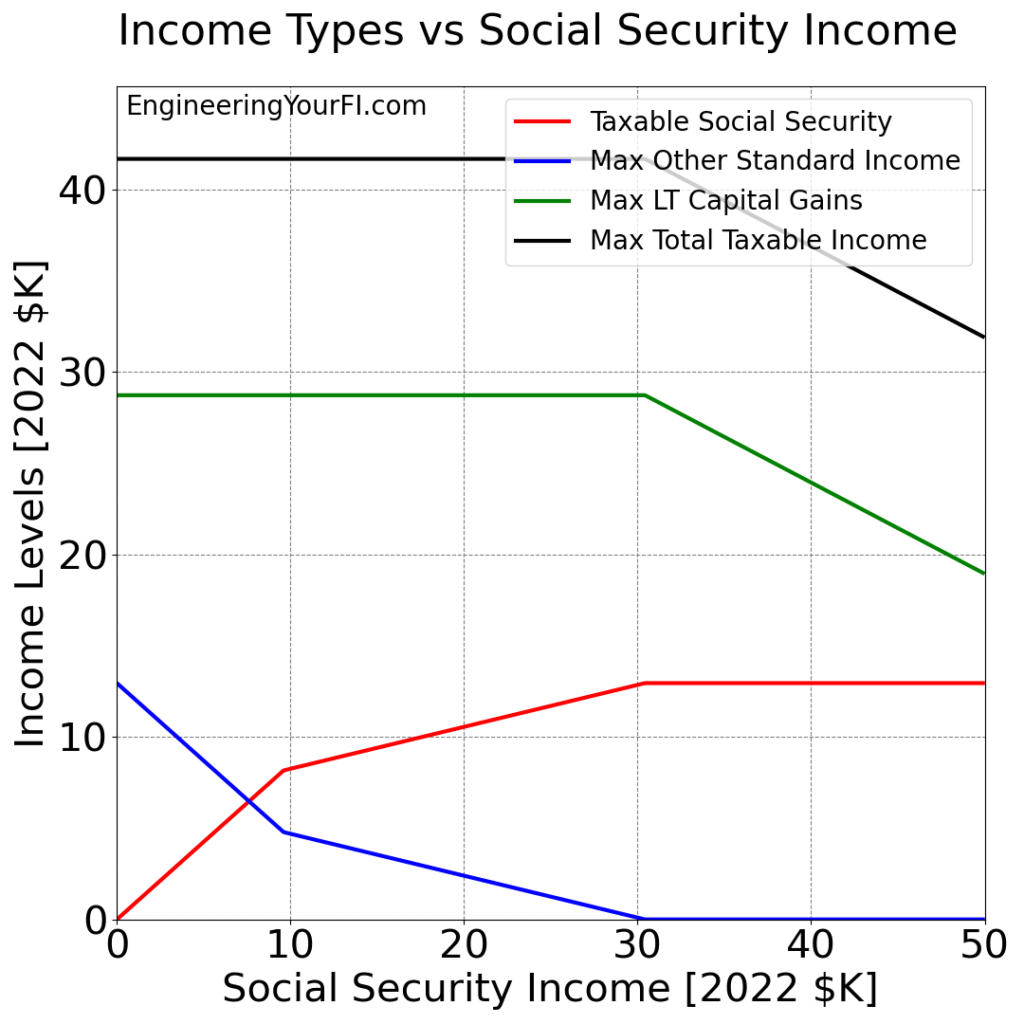
Taxable RIB (red) starts at $0 and levels off at the standard deduction value of $12950 when RIB is around $30K. The maximum non-RIB standard income (blue) does the opposite: starting at the standard deduction value of $12950, it levels off at $0 when RIB is around $30K. And during that interval from RIB = $0K to $30K, the max LT cap gain value (green) remains constant – because the total standard income (taxable RIB + non-RIB) never exceeds the standard deduction.
The maximum total taxable income (black) also remains constant, because the other three other lines alway sum up to the same value.
After $30K, the max LT cap gain value shrinks as needed to ensure the taxable RIB stays at the standard deduction value, which means the maximum total taxable income also shrinks. But your RIB is also increasing to quite sizable amounts, so you are likely to be just fine from a cash flow perspective. And this way you ensure no taxes are paid on your RIB.
There is one interesting additional bend point between $0K and $30K though: shortly before $10K RIB, the slopes of both the taxable RIB and maximum non-RIB standard income become significantly less steep. What’s the deal with that?
Turns out that is the point when Taxable RIB shifts from 85% of the RIB value (you can see the slope is pretty close to 0.85 for Taxable RIB prior to that point, and -0.85 for non-RIB) to values less than 85% as dictated by the taxable RIB algorithm. Prior to this point, the RIB value is small enough versus non-RIB and LT cap gains that the taxable RIB is 85% of RIB, but after that point, a different branch of the taxable RIB algorithm is employed (taxable RIB = taxable portion in the 50% bracket + taxable portion in the 85% bracket).
Filing Status: Married Filing Jointly
Next up, let’s look at the same plot for the Married Filing Jointly status. Though I’ve increased the plot x axis from $50K of RIB to $100K of RIB, due to the larger maximum RIB possible for a married couple.
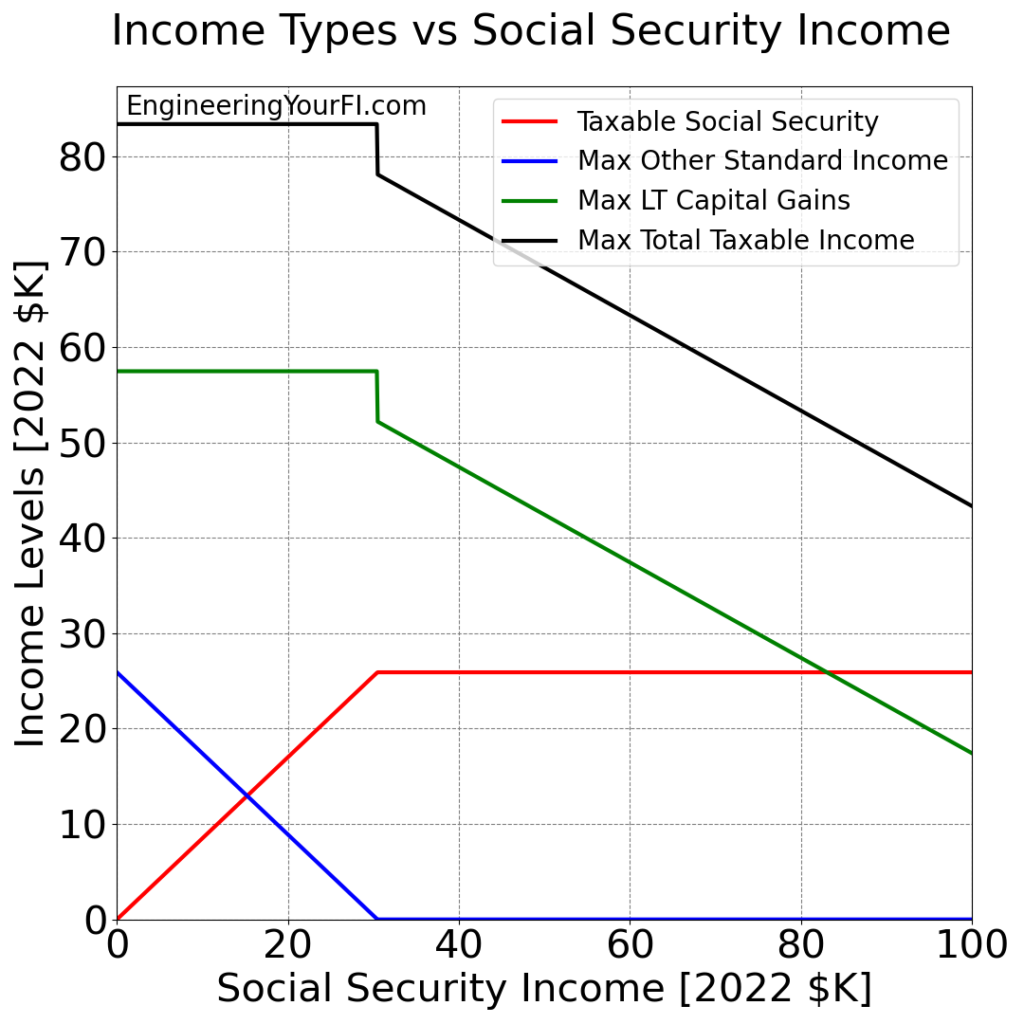
You can see how the taxable RIB line (red) has the same slope until it hits the “married filing jointly” standard deduction of $25900, indicating that it equals 85% of RIB until that point (around $30K RIB). And just as in the previous plot, the maximum non-RIB standard income (blue) does the opposite of the taxable RIB, leveling out at $0, and the max LT cap gain value (green) remains constant.
When the taxable RIB reaches the standard deduction level around RIB = $30K, there is a large instant jump down in the max LT cap gains. What’s the deal with that?
In general, I’m always suspicious of large instant jumps like this (very often it’s a bug in the algorithm or implementation), but in this case I believe it’s legit: because the taxable RIB did not exit the “85% of RIB” region mentioned above prior to this point, the max LT cap gains have to jump quite a ways down for the taxable RIB to depart that “85% of RIB” region. Otherwise it won’t be possible to keep the taxable RIB at the standard deduction level by lowering the max LT cap gains – it will simply remain 85% of RIB. But from that point on, a simple linear reduction in the LT cap gains is enough to keep the taxable RIB at the standard deduction value.
Example Scenarios
Now that we’ve waded through the algorithm and some pretty plots, let’s show how this method can save you $$$. And remember that this method is used within the TPM method, so you automatically get these benefits if you employ that method.
Also note that I’ve not accounted for taxes that might result from required minimum distributions (RMDs) that start at age 72 – future post.
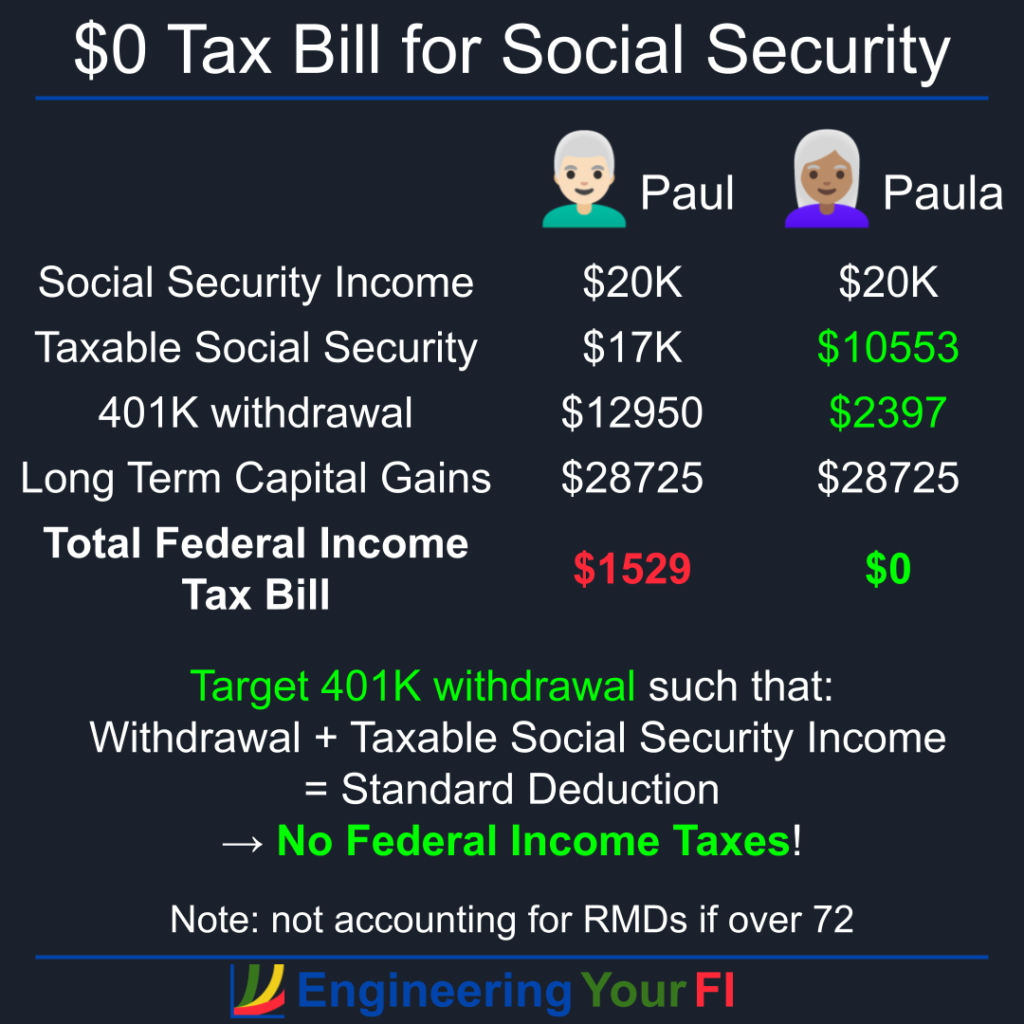
Paul and Paula: Retired and Single
Paul and Paula are single retired people that are now both receiving $20K a year in social security income (RIB).
Paul doesn’t know anything about how his RIB is taxed, and he’s not too concerned about it either. He did read somewhere that it’s a good idea to max out your standard deduction ($12950 for 2022) with retirement account withdrawals, and to sell enough shares in his brokerage account such that his cap gains (including any qualified dividends he has) plus retirement account withdrawals add up to the top of the 0% tax bracket for single filers ($41675 for 2022 – which means $28725 LT cap gains). But he doesn’t think about how his RIB is taxed at all.
As a result, $17K of Paul’s $20K RIB is taxable, and he will owe $1834.50 in federal income taxes.
Paula is a bit smarter and employs the targeting income approach we’ve discussed. As a result, her taxable RIB is $10553.38, she pulls $2396.62 from her retirement account (instead of $12950 like Paul), her LT cap gains (including qualified dividends) are $28725 (same as Paul), and her federal income tax bill is $0.
She then buys a very fancy bottle of champagne for $1834.50 to celebrate – and it’s the best champagne she’s ever had.
See the diagram at the top of the post for a graphical version of this example.
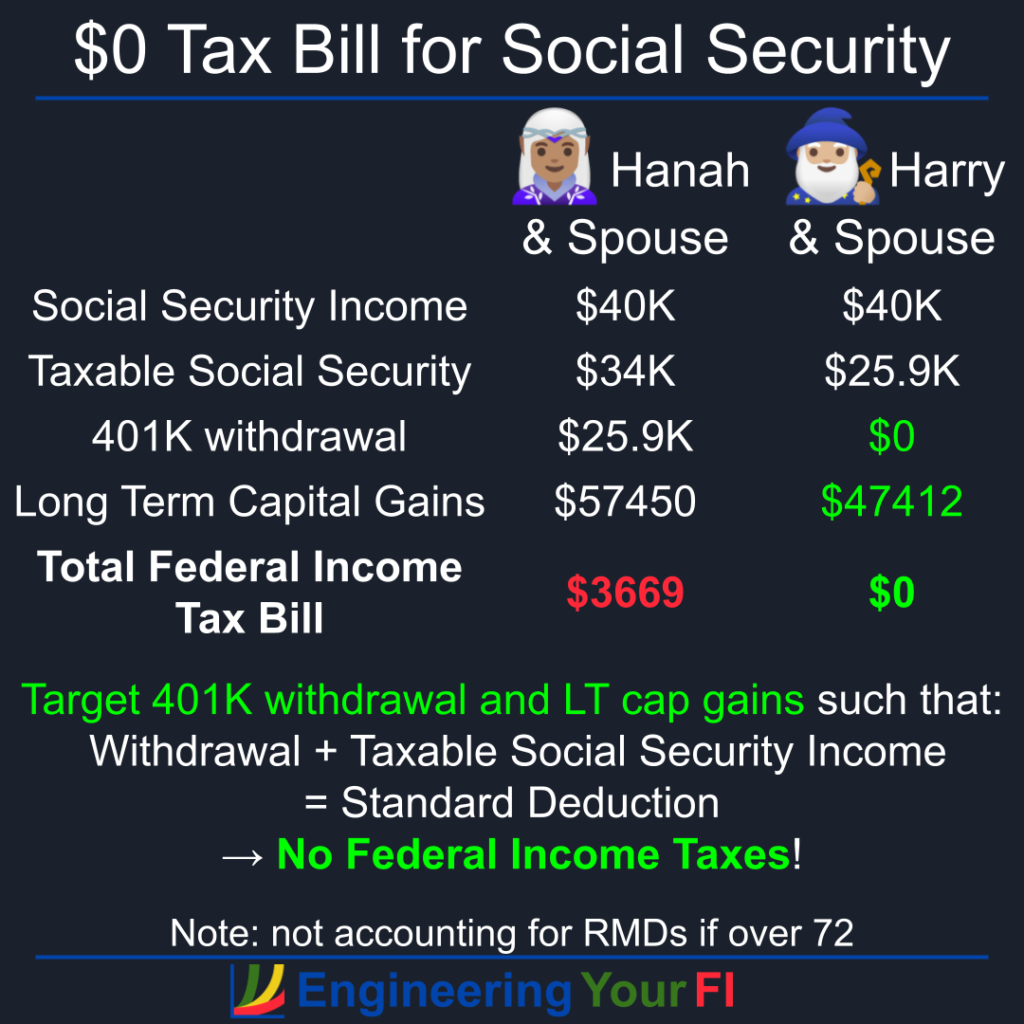
Hanah and Harry: Retired and Married
Hanah and Harry are both married (not to each other) and retired, and each couple pulls in $40K a year in RIB.
Hanah and her partner are like Paul above: they don’t know anything about how RIB is taxed, and they believe it’s probably not that important. Again like Paul, they did hear it’s a good idea to max out their standard deduction ($25900 in 2022) with retirement account withdrawals, and to max out their 0% LT cap gains bracket ($83350 in 2022 – which means $57450 LT cap gains) by selling shares in their taxable brokerage account.
The result: $34K of their $40K RIB is taxable, and they will pay $3669 in federal income taxes.
Harry and his spouse are a bit smarter, like Paula above, and employ the targeting income method. Thus their taxable RIB is $25900 (equal to the standard deduction, so no funds are pulled from their retirement accounts), their LT cap gains (including qualified dividends) are $47411.76, and their federal income tax bill is $0.
They then fly to Paris in business class for $3669, clinking their champagne glasses to the power of MATH. (Though of course they wouldn’t actually pay this amount – they would use points!)
Here’s a pretty graphical representation of this example:
Code
If you’d like to plug in your expected or actual social security income, along with any other sources of income you can’t easily dial up and down (e.g. a pension), you can download the code or modify and run the embedded Python interpreter below.
You can then see the maximum amount of non-SSI standard income and maximum LT cap gains you should strive for in order to not pay any taxes. You can also view the same plots shown above for the different filing statuses, and tweak those to your liking if desired.
Modify the user inputs section at the top as desired, then hit the Run/Play (sideways triangle) button to generate the plots. To go back to the script to make any changes, hit the Pencil icon. If you want the text larger, hit the hamburger menu button, then scroll to the bottom to see larger font options. In that same menu you can also Full Screen the window, and other actions.
Note that you can use the inputs labeled as “married filing jointly” and “other filing status” to obtain the same plots as above. Use the pound sign “#” to comment out a line so that it’s not used.
Note: any references to “SSI” in the code stand for normal social security income (RIB), not Supplemental Security Income (a different program that is also provided by the Social Security Administration).
Future Work
Everything in this post revolves around paying $0 in taxes – but if your situation doesn’t allow that for some reason it can also be advantageous to ensure you stay in the lowest or lower tax rates. It would also be neat to look at a plot of the taxable RIB, and the resulting taxes, if you don’t adjust the LT cap gains once the taxable RIB reaches the standard deduction value. And you could also just adjust the LT cap gains by the amount the taxable RIB exceeds the standard deduction, so the total remains at the top of the 0% LT cap gains bracket – you’d just start to pay taxes on the standard income because it exceeds the standard deduction (and still no LT cap gains taxes).
Conclusions
Much like investing, taxes can get a bit complicated at times. But unlike investing, which can be very volatile and random (in the short term) by nature, taxes are a deterministic set of rules which we can study and optimize to our heart’s content – without worrying about if we have to completely change our strategy every year.
Targeting your non-RIB standard income and LT capital gains when you have RIB is a fantastic example of this – I know that no matter what the markets are doing any particular year, this approach will likely save thousands of dollars in taxes every year.
Many (most?) people also don’t seem to realize how feasible it is to pay ZERO federal income taxes each year as a retiree. With just a little math and planning (and some fun numerical optimization tools), you can maximize your taxable income while paying no taxes – which means more money for retirement spending or continuing to grow your portfolio for eventual future charitable giving or your children’s inheritance(s).