Last Updated: September 22, 2022

50%. Or higher. 70% to 80% is even better.
Am I serious? I can’t possibly be serious. Right?
Actually, yep, I am totally serious. And yes, I know that’s a crazy simple answer and probably seems totally impractical for most readers. But hear (read?) me out.
If your household income is way below the US median of $67,521, then absolutely my 50% number will sound ludicrous. At low incomes, you’re far more likely to be scraping by, and it’s much harder / nigh impossible to achieve a 50% savings rate. But it’s still the savings rate I think you should shoot for, via increases in your income or building your frugality muscles to further reduce your expenses. But why? Why not something much easier like 5% or 10%, like most people aim for?
Time to FI, Starting with $0
Turns out that the time it takes to achieve financial independence from a net worth of $0 is a function of three things:
- Your savings rate (computed from your post-tax income and expenses, assuming your expenses stay the same after achieving FI)
- The investment rate of return assumed, after taxes and inflation (usually something conservative like 7%)
- The safe withdrawal rate assumed, (the percentage of your total portfolio you can safely withdraw each year, adjusted for inflation each subsequent year, if you stopped working and wanted to make sure you never ran out of money), usually set to 4% (also known widely as the “4% rule”)
Of those three items, your savings rate is what you have (by far) the most control over. Items 2 and 3 are also important, and often overlooked in some articles about the time to FI, but your savings rate is still what matters most.
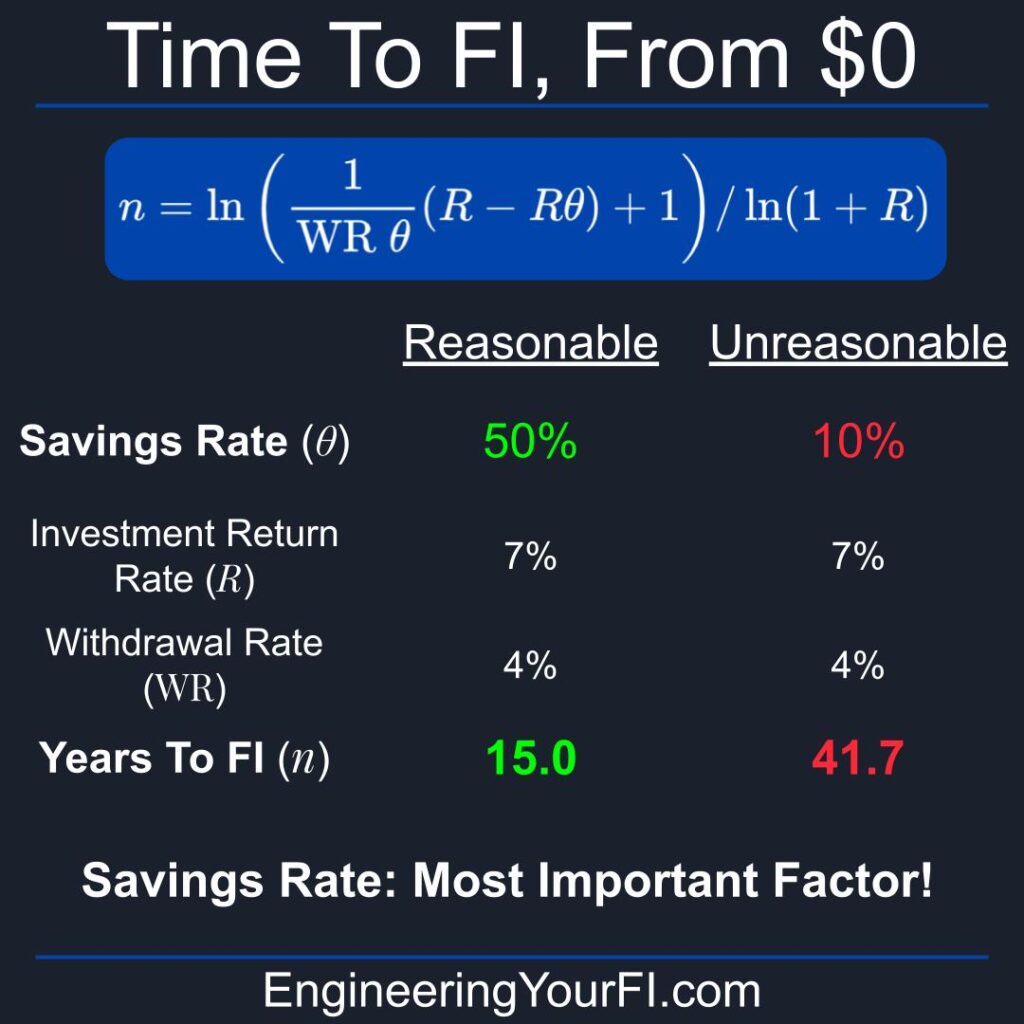
So if you have nothing in the bank, and you have all three of those numbers (savings rate, assumed investment interest, safe withdrawal rate), how do you calculate the number of years it’ll take to get to FI? Via this wonderful looking equation*:

where  is the number of years,
  is the withdrawal rate,
  is the investment interest rate, and
  is the savings rate.
Isn’t that nice looking? Well, if you don’t agree (though I don’t see how you could disagree), the good news is that you fortunately don’t have to memorize this equation (though you might want to, just in case). Also fortunately, we can use some reasonably conservative assumptions for the assumed investment interest (7%) and safe withdrawal rate (4%), and then build ourselves a nice pretty plot of the time to FI versus savings rate (which matches other tools I’ve used):
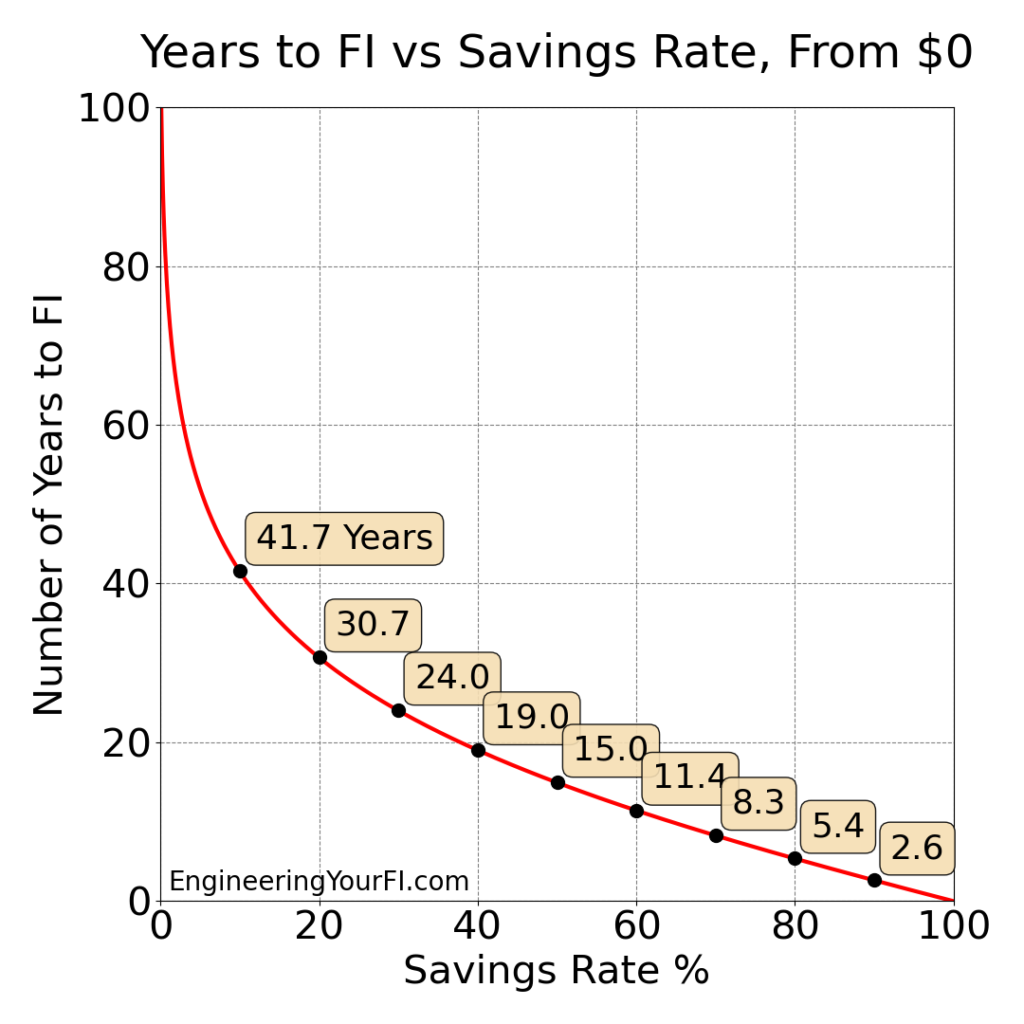
This plot is very interesting for a number of reasons. On the far left side, you can see how the amount of time needed to achieve FI exponentially approaches infinity as the amount of money you save approaches 0. That should scare the crap out of people, yet Bankrate’s July 2021 Emergency Savings Survey found that 51% of Americans have less than three months’ worth of expenses saved up, and 25% have literally nothing at all. Gah, that is terrifying just to read, much less experience! The plot above easily shows us why – these people will likely never be free to stop working, unless they can live on social security alone. And even a 10% savings rate, which many think is fantastic, has you doing mandatory work for over four decades.
If you look at the left half of the plot overall, from 0 to 50% savings rate, you can see an incredible reduction in the years of mandatory work. The vast majority of the years you gain from saving more is seen by increasing your savings rate to 50%, which is why I push so hard on that number. At 50%, you’re looking at 15 years of servitude, vs 41.7 years with a 10% savings rate – literally decades of your life you get back.
On the right side of the plot, the gains become smaller and effectively linear (instead of exponential) as you approach 100%. Why linear? Because such little time will pass until you’re FI that there will not be much growth of your portfolio from investment returns. Instead nearly all the growth will happen from your savings. Which is of course totally fine, if you want to get to FI as soon as possible, but it’s important to recognize that there are diminishing returns as you crank up your savings rate ever closer to 100%. A 70% savings rate gets you to FI in 8.3 years, 80% gets you to FI in 5.4 years, and 90% gets you there in 2.6 years. So we’re talking single-digit years now – not decades.
Higher Investment Interest Rate
Now some would argue that a 7% annual investment ROI is a tad too conservative, even after accounting for inflation and taxes. If we increase the ROI up to 10% per year:

You might be thinking, “uh…. that plot doesn’t actually look all that different.” And you’re right! Even increasing the ROI on your investments up to 10% per year only changes the time to FI from 15 years to 13.1 years if you’re saving half your income. So your savings rate still completely dominates this curve. And most importantly, you have CONTROL over your savings rate – you have effectively no control over the stock market (unless you happen to be in the C suite of one of the S&P 500).
Lower Safe Withdrawal Rate
Another common argument is with the Safe Withdrawal rate: given how expensive stock is right now, shouldn’t we be using a more conservative safe withdrawal rate, like 3 or 3.5%? Yes, in fact that’s true, we should probably be using a lower rate, though 3.5% appears to be the safe withdrawal rate floor based on the work by the Mad Fientist and Michael Kitces. So what happens to our plot if we use the more conservative 7% investment rate return and more conservative 3.5% safe withdrawal rate?
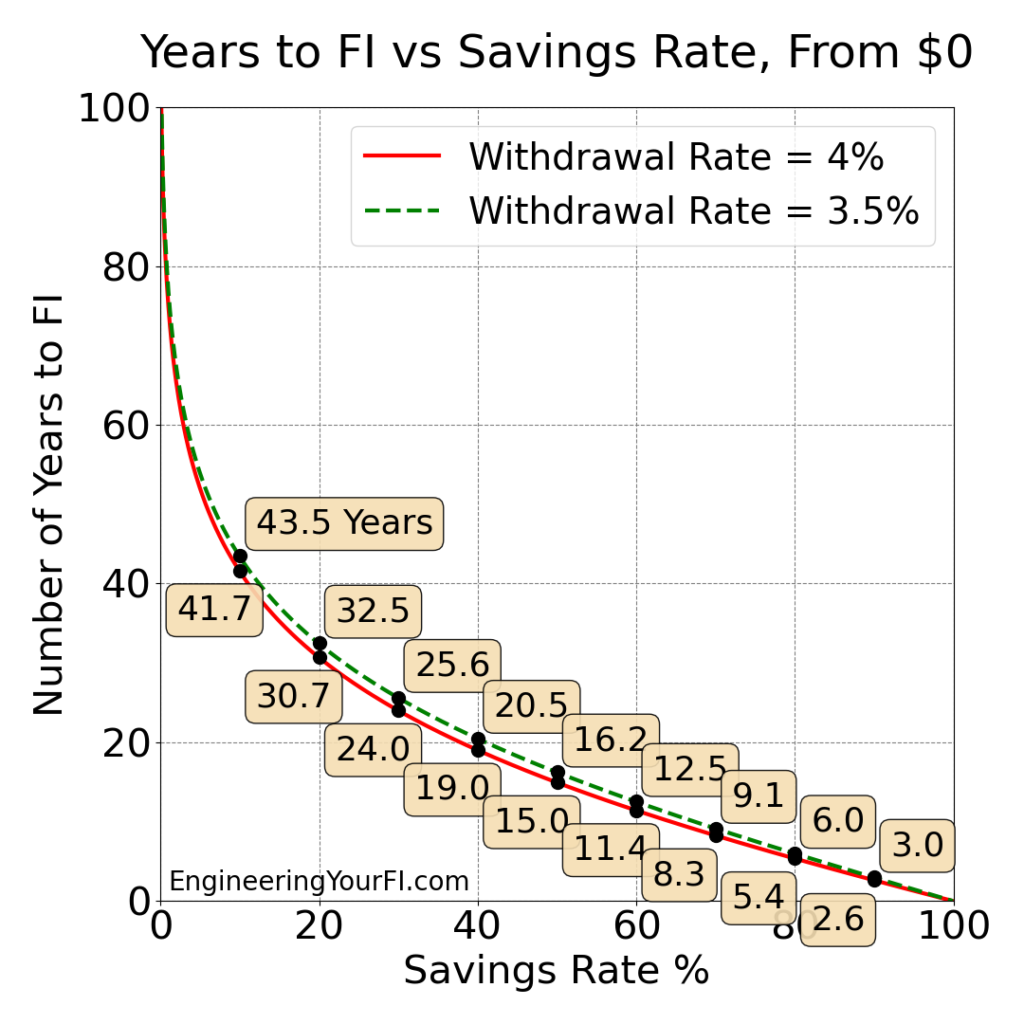
Looks like this adjustment had even less impact – the lower withdrawal rate line is only slightly above the standard 4% withdrawal rate line. For a 50% withdrawal rate, you’re looking at only an extra 1.2 years. Once again, savings rate completely dominates.
Why Saving 50% Is So Important
OK, hopefully I’ve convinced you that your savings rate is the most important factor in how long it takes to achieve FI. But this idea of your savings rate (mostly) dictating your time to FI can still be unintuitive to a lot of folks.
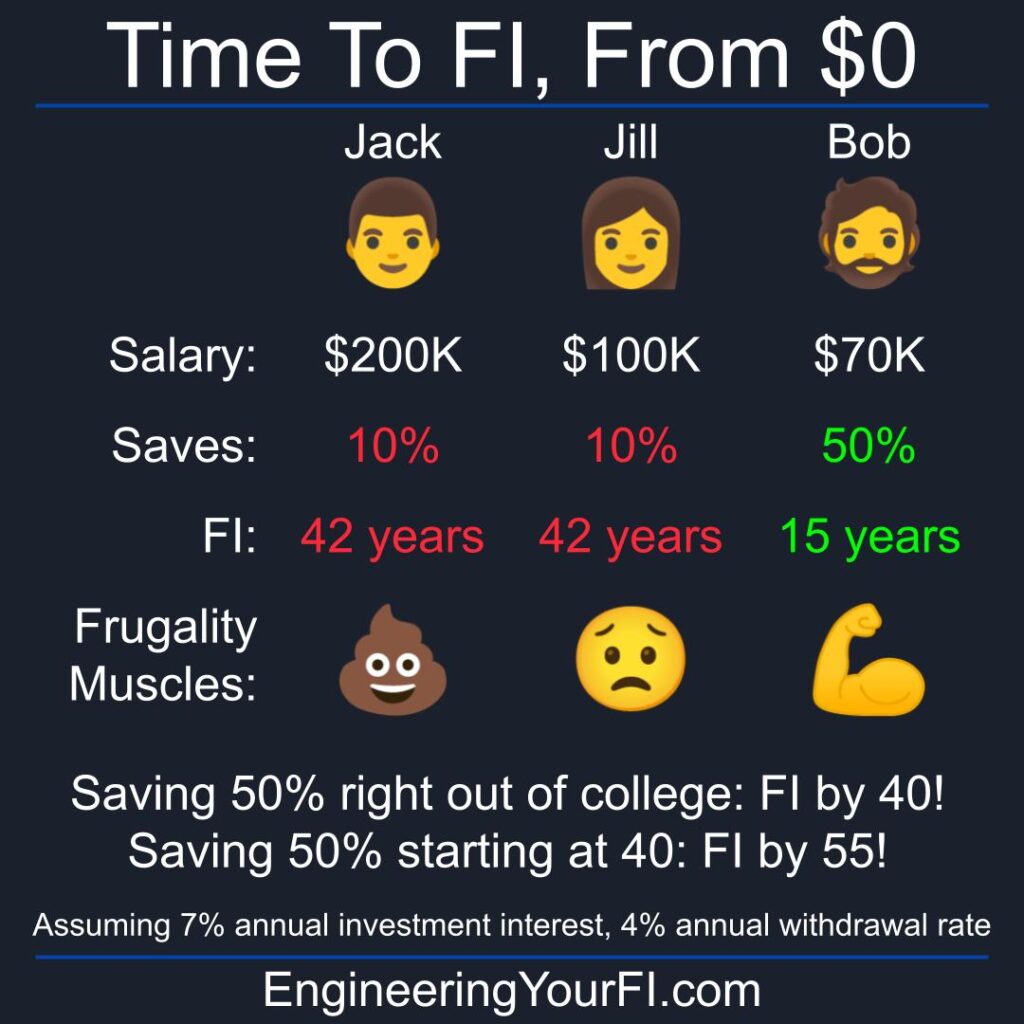
Surely someone making $200K/year with a 10% savings rate is going to get to FI faster than someone making $50K/year with a 20% savings rate, right? Nope: if both of those people start with a $0 net worth, the high income person will reach FI in 41.7 years, while the low income person will reach FI in 30.7 years. Why though? Because while the high income person earns much more, he or she also spends a ridiculous amount.
In fact, I have far more respect and admiration for someone making $50K/year with a higher savings rate than someone making 4x more with a lower savings rate. That person has far stronger frugality muscles, and will not only achieve FI faster, but also handle any disruptions to their income far better.
Mr. Money Mustache has arguably the most popular post on the internet regarding the power of your savings rate. He uses an even more conservative (probably excessively conservative) 5% investment rate of return, so his year numbers are even larger – and they show how your savings rate even more completely dominates your time to FI if the markets don’t perform as well as expected.
So if you get out of school around age 22 and save 10% while working full time, you can retire at 63.7 – basically the “standard” working career. And if you’re not saving at least 10% (which is frighteningly common), you can look forward to mandatory work your entire adult life (unless you can somehow get enough via social security to make ends meet).
Here’s a better idea: save 50% of your income, and be free of mandatory work in your 30’s.
What if you’re not 22? If you’re 30 right now with nothing in the bank and you start saving 50%, you’re FI by 45 – a still very early “retirement” compared to most folks. And if you’re 40 now, you’re FI by 55, and you then don’t have to rely on social security to remain financially solvent during your older years.
Thus a 50% savings rate (or higher) is what you need to achieve FI in what I consider a reasonable amount of time: less than 20 years, and hopefully closer to 10 years or less (depending on how the market does).
There are some folks that will go pretty extreme with a savings rate over 90%, thus obtaining FI in just 2 or 3 years, but I think you should only go that high if it’s comfortable and enjoyable (i.e. you make enough to easily live on less than 10% of your income). Remember, the above curves are pretty linear at super high savings rates. For these reasons, I think a 50% to 80% savings rate is a nice middle ground.
Another important note: I consider contributions to retirement accounts as part of the take-home savings rate, because eventually you can pull those funds out with no penalties and minimal taxes, even if you’re not 59.5 yet. But I’ll explore tax implications in a future article (and try to remember to provide a link here).
My wife and I had an average savings rate of around 70% during our climb to FI, and it took us a little less than 4 years after I got my degree and started working full time (which was when we learned about FI and started to seriously pursue it).
Now hopefully you’re looking back at the plots above and thinking “but a 70% savings rate corresponds to 8.3 years of working, not 4 years…. What is he trying to pull here?”
The main reason that math doesn’t line up: we didn’t start from zero. We also were fortunate to have a stellar bull market during those 4 years, and we also worked hard to reduce our expenses over time.
Compute Your Time To FI
Wondering what *your* nominal time to FI is? Well, great news: I recently figured out how to embed a python interpreter in this post! That means you can adjust the inputs in the window below to your situation/liking, hit the Run/Play (sideways triangle) button to run the same python code I wrote for this post, and it will output the number of years and the same plots you see above. To go back to the script to make any changes, hit the Pencil icon. If you want the text larger, hit the hamburger menu button, then scroll to the bottom to see larger font options. In that same menu you can also Full Screen the window, and other actions.
I’ll admit this is the first time I’ve used this trinket.io service, so if you see issues, let me know.
I have the Safe Withdrawal Rate (SWR) set to 4% by default, and a conservative expected investment rate of return of 7% by default. Feel free to mess with those values to be more or less conservative for your taste, but otherwise you can just leave those as-is.
But what about your savings rate? What if you don’t know what that is? Well, the math is easy: savings (income minus expenses), divided by income. And most people know about how much they make a year. The hard part for most folks: computing how much they spend each year. But tracking your expenses is incredibly vital. If you’re not already doing that, now’s the time.
If you want to get your hands a little dirty and make some changes below the inputs section, feel free! E.g., you can tweak the plots to your liking. You can also just download the python script and run it locally on your machine, if you’re interested/comfortable installing/using python on your computer.
There are also a TON of other great Financial Independence calculators available online (all much prettier than mine I’m sure). Here are a few of my favorites, which have tons of great options you can adjust:
Summary
A lot of folks will follow the advice of Dave Ramsey and others about getting out of debt (obviously a hugely important first step), and those folks probably had to significantly up their savings rate to accomplish that goal. If you’re one of those folks, I hope I can convince you to not stop the high savings rate once you become debt free, but keep going until you’re FI!
If you can get your savings rate to 50% or higher, through cutting your expenses, increasing your income, or both, you will slash many decades of required employment from your life. And then you get to decide whether you want to work or not, which is ultimately what FI is all about.
* When I first started writing this post, I had ALL the math leading to this equation in the post, but I soon realized that was likely equation overload for a blog post. So I scraped (most) of the math and stuck it in a separate document, which you can find here. If you’re mathematically inclined, feel free to check my work, and let me know if you find typos/errors! I did check the results I got against some other calculators though, and they were consistent.