Last Updated: September 22, 2022

In the last article, I described how the time it takes to achieve Financial Independence is based on three factors: 1. Your savings rate (by far the most important factor), 2. the assumed investment ROI (usually something conservative like 7%), and 3. the withdrawal rate assumed (usually around 3.5 to 4%).
BUT, I used a big assumption: starting with $0.
But really, nobody has a net worth of exactly $0.00 (well, I’m sure there might be a handful of exceptions at any one time on a planet of 7.9 Billion).
Now if your net worth is pretty close to $0 (say within a few hundred dollars above or below $0), the timelines for FI starting from $0 are pretty accurate.
But what if you’re not within a few hundred dollars of zero, as I suspect is the case for the majority of folks?
In this article, we’ll consider how our timelines change if your net worth is a non-trivial amount above zero. The next article I’ll focus on how your time to FI changes if you have non-trivial debt, and thus a net worth well under $0 (link forthcoming).
How Starting Balance Affects Time to FI
Turns out your time to FI is a function of a couple more things when not starting from $0:
- Your starting balance
- Your expenses (see next section)
The first factor is pretty obvious to most folks: if you start with more than $0 in the bank, it’s going to take less time to get to FI (assuming you don’t increase your spending). And if you start $1 shy of your FI goal, then obviously your time to FI will be practically zero.
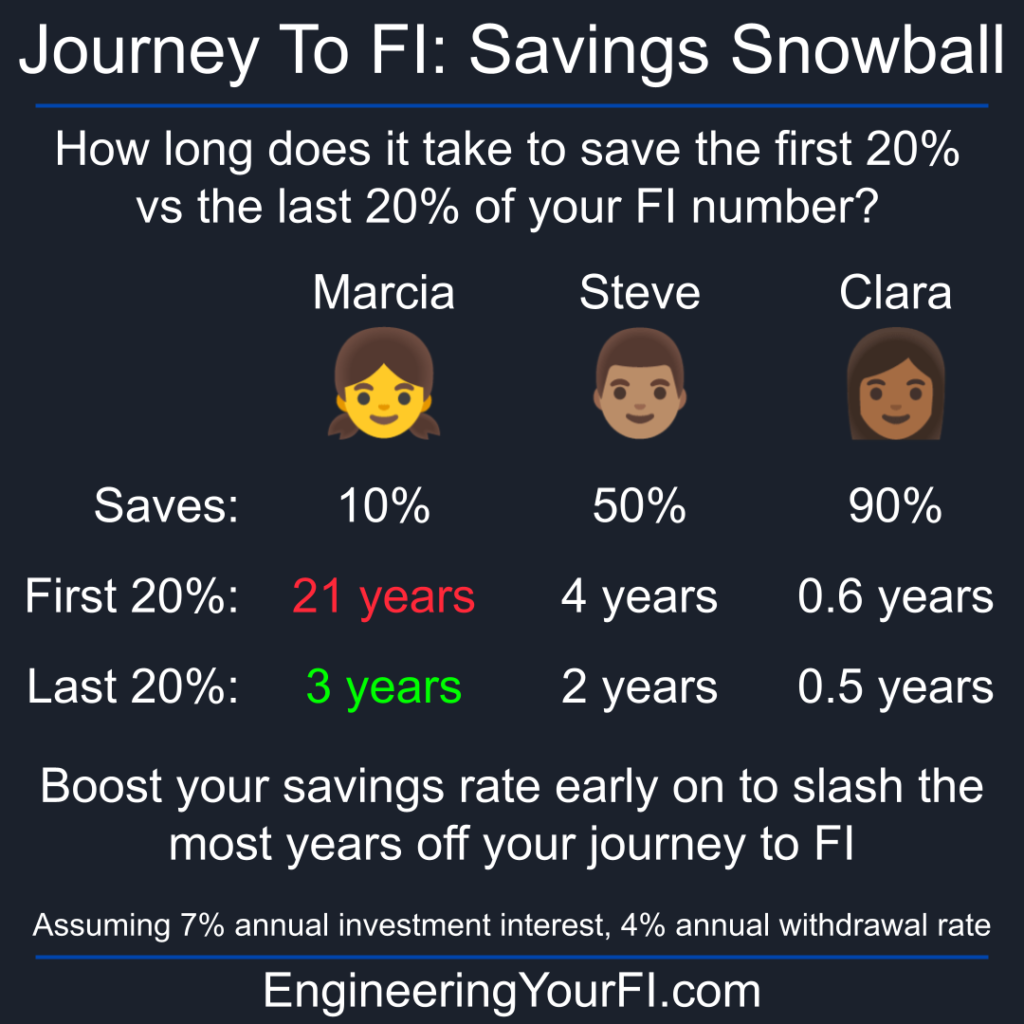
If your savings rate is something pretty low like 10%, your initial balance plays a huge role due to how long it takes to accumulate the initial funds in your FI snowball. The time it takes to reach 20% of your FI goal is about 21 years for a 10% savings rate, versus just 3 years to obtain the final 20% of your FI goal. So if you can find a way to get extra money early on (especially if you’re young and have fewer commitments), that can slash a huge amount of time off your journey to FI.
If you have a more reasonable savings rate like 50%, your starting balance is still important but less so than when your savings rate is 10%. The first 20% of your FI number takes about 4 years to gather, versus 2 years for the final 20%. Less than half the time! But also not a 7x reduction – which is good news if you’re older and don’t have decades for compounding to work its magic.
Finally, if you have a very high savings rate like 90%, your time to FI will be relatively short and your portfolio will grow fairly linearly (assuming constant income). In other words, the first 20% of your FI number will take 0.6 years, versus 0.5 years for the final 20% – about the same amount of time!
Reducing Your Savings Rate Part Way to FI
Thinking about how your initial balance affects your time to FI allows us to consider what might happen if you change your savings rate part way to FI.
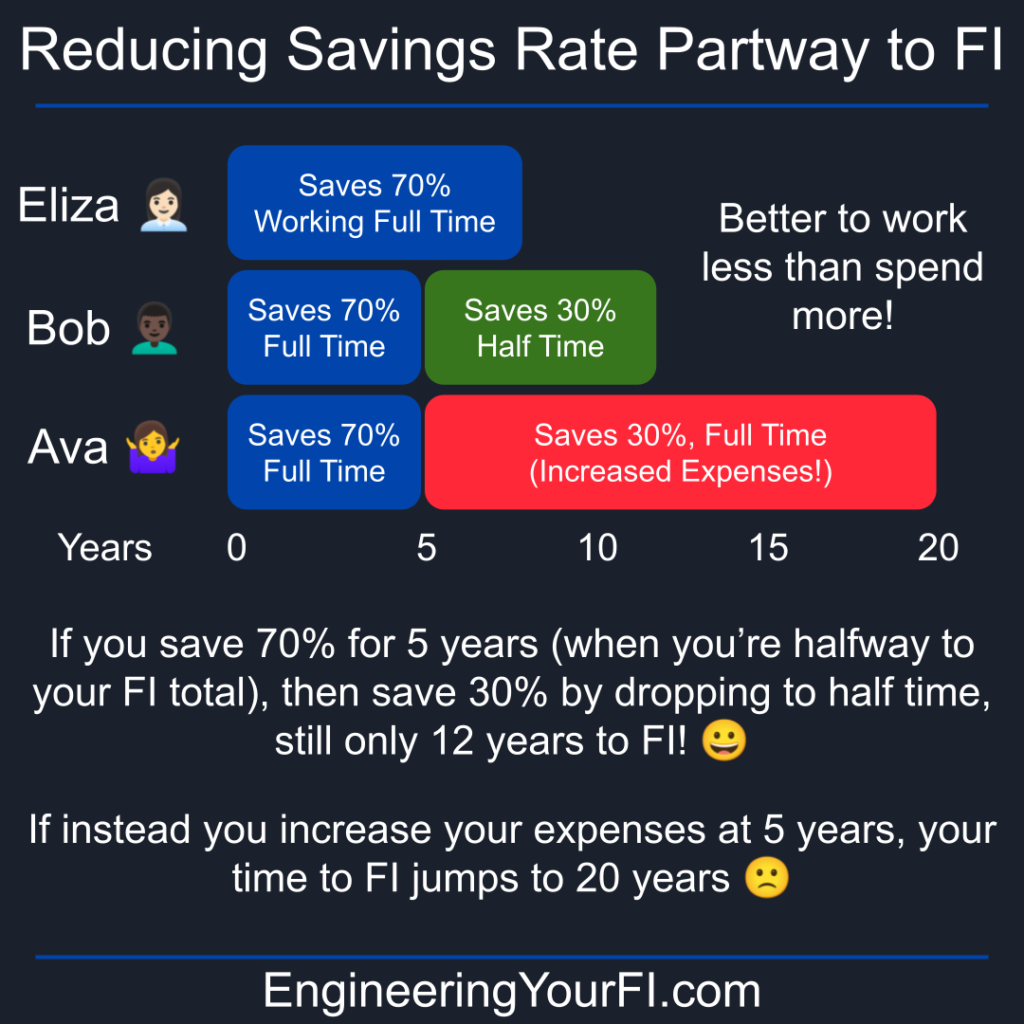
Let’s say your expenses are $40K/year, and thus your FI number is $1M (4% withdrawal rate). Let’s also say you find a way to save 70% of your income until you reach $500K (halfway to your FI goal), which takes about 4.7 years.
Then let’s say you decide you’re tired of working full time and want to drop to half time and take a 57% pay cut (accounting for loss of benefits, etc.), which drops your savings rate to 30%. Your expenses stay the same: $40K/year.
The remaining time to FI would be 7.6 years. Total time to FI: 12.3 years.
Not too bad! Not that much longer than the 8.3 years it would take with a 70% savings rate the entire time, and you’d be working half time the final 62% of that 12.3 years. Nice!
However it doesn’t work as well if you increase your expenses when you reach that $500K mark. If you increase your spending to $93333 to land a 30% savings rate, that means your FI number is now $2,333,333 instead of $1M, and it will take 14.7 years to finish your journey to FI – nearly double the 7.6 years you’d be facing if you had reduced your income instead.
Why is it so much worse to increase your expenses than it is to decrease your income? You have a 30% savings rate either way, right? The answer lies in the next section.
How Expenses Affects Time to FI with Net Worth Over $0
Now why does the expenses number only matter if you start above $0? Well initially I was going to provide a full derivation of the “time to FI” that accounts for a non-zero balance, which results in this final equation:

Where  is the number of years,
  is the savings rate,
  is the withdrawal rate,
  is the investment interest rate,
  is the initial value of the portfolio, and
  is annual expenses.
Isn’t that the most beautiful equation you’ve ever seen in your entire life? I’m glad you agree.
BUT, I’m pretty sure the majority of readers won’t care about this derivation* (though why everyone doesn’t love long detailed mathematical derivations is a mystery to me). So instead I put the derivation in a PDF using LaTeX that you can review if interested.
Instead, I’ll attempt to provide an intuitive explanation.
Let’s say your savings rate is fixed (say a reasonable 50% or higher), we assume constant conservative values for market ROI and withdrawal rate, and you have some non-zero amount of money saved up already.
If your expenses are low, then your “FI number” (25x your annual expenses, if using a safe withdrawal rate of 4%) is lower. If your expenses are higher, your FI number is higher. So for a particular starting balance, the lower your expenses are, the closer you are to FI.
An Example
Let’s use some numbers in an example to further explain why expenses matter, on top of your savings rate, if not starting from $0.
Let’s say your FI number is $1M, because you spend $40K per year (4% safe withdrawal rate). You’re saving 50% of your income (so your income is $80K), and you’ve managed to save up $200K in your retirement accounts before discovering the concept of Financial Independence.
For a standard conservative investment ROI of 7%, you’re looking at 10.5 years to FI.
Now let’s discuss your friend Joe, who also saves 50% of his income. But his FI number is $2M, because he spends $80K a year. That also means his income is double yours, at $160K. But he’s got the same amount “in the bank” as you: $200K.
For the same standard conservative investment ROI of 7%, Joe is looking at 12.6 years to FI. His path to FI is over two years longer than yours, even though you have the same savings rate and he makes twice as much as you! And it’s because $200K is so much closer to your FI number of $1M than his FI number of $2M – i.e. your frugality muscles are twice as strong as his.

Years to FI vs Initial Balance
Of course we have to have some pretty plots as well.
In the plot below, you can see how your starting balance affects your time to FI, for a variety of savings rates (10% to 90%). I’ve kept expenses constant ($40K), so the final “FI number” remains $1M for a 4% withdrawal rate – which means incomes are different for each of these savings rates. As above, I assume a withdrawal rate of 4% and an investment ROI of 7%.
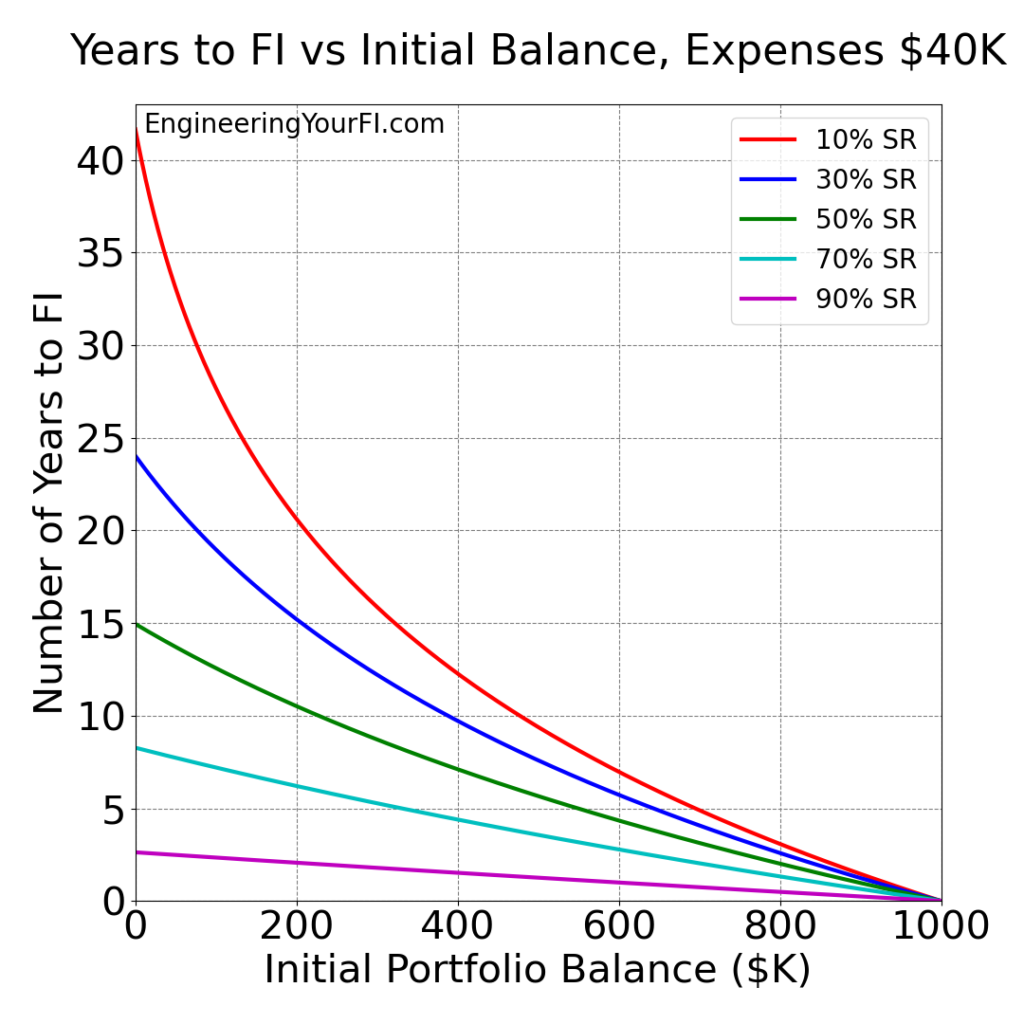
You can see how for a high savings rate, e.g. 90%, the line is effectively linear – a straight line from 2.6 years at $0 Initial Balance to 0 years at $1M.
But with lower savings rates, the power of compounding reveals itself, as well as the power of having a non-zero balance. E.g. if you have a 10% savings rate with a horrendous 41.7 years of required work ahead of you, you can slash a huge number of years off your time to freedom if you can pull in some extra cash early on via side hustles, etc. If you could start at $200K instead of $0, you’re looking at 20.6 years instead of 41.7 years to FI – cutting your years of required work in half!
Of course we can’t ignore the fact that if you boost your savings rate to 50%, you’re looking at 15 years starting from $0 – five less years than someone with a 10% savings rate that starts with $200K. Savings rate is still King/Queen when it comes to getting to FI faster.
Years to FI vs Expenses
Now let’s take a look at how your expenses can impact your time to FI when you have a non-zero initial portfolio balance.
In the plot below, you can see how your expenses affect your time to FI when starting with an initial balance of $200K, for a variety of savings rates (10% to 90%). As above, I assume a withdrawal rate of 4% and an investment ROI of 7%.
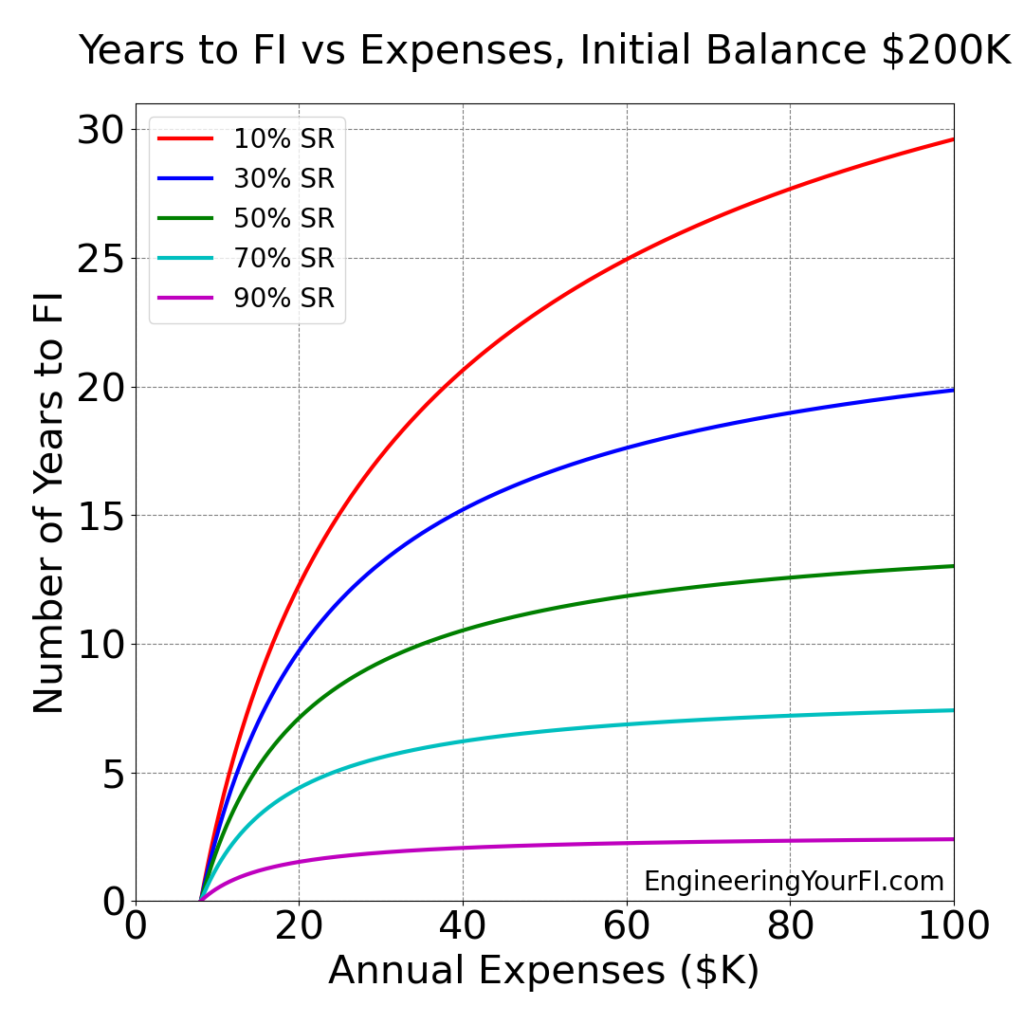
First note how all curves start at $8K – because if you have $200K saved up and are spending just $8K a year, you’re done! 4% of $200K is $8K.
And if you think having total expenses of $8K / year is impossible, go check out Jacob at Early Retirement Extreme.
If you’re saving just 10%, then as your expenses go up, your time to FI goes up pretty dramatically, zooming on up past 25 years if you’re spending over $60K. And that’s with over $200K already saved!
Whereas if you’re saving at least 50% of your income, your time to FI only reaches 13 years if you spend $100K or more a year – otherwise you’re likely looking at about a dozen years or less to freedom.
You can also see on the 50% curve the values from the earlier example of you ($40K spend, and thus 10.5 years to FI) and your friend Joe ($80K spend, and thus 12.5 years to FI, two more years than you!).
Interestingly, if you’re saving 90% of your income, the time to FI appears to asymptotically approach a constant value as your expenses rise. I guess if you can find a way to save 90% of your income even if you’re spending $100K a year (i.e. you’re making a million dollars a year), then you’re still looking at just a few years to get to freedom. That $1M/year is the tricky part though!
What’s neat though is that if your household is making $300K a year (and quite a few households do, far more than $1M/year households), and you can get your expenses down to $30K a year (quite reasonable if you’ve paid off your house), then that 90% savings rate gets you to FI in slightly less time than $1M/year household!
Our story
As I mentioned in our Savings Rate post, my wife and I saved about 70% of our income on average and achieved FI about four years after learning about FI and setting it as our goal. Also mentioned in that post is how 4 years is much less than the 8.3 years a 70% savings rate will get you to FI if starting with $0.
One factor behind our accelerated time table was obviously the incredible bull market we experienced during those 4 years (2016 to 2020). Even 2020, with the powerful but short lived bear market when the pandemic started, ended up a healthy amount by the end of the year.
But another factor was also vital: our starting net worth when I finished up my PhD.
Prior to my PhD I worked in industry for several years, where I saved some money in my retirement account and a bit in a post-tax brokerage account. Then we continued working hard while I was in school, and my wife was working full time, to build a reasonable amount of savings, with a savings rate probably around 5 to 10%.
Much (most?) of that savings was done via Mrs. EYFI’s retirement account, taking full advantage of her company’s matching program, but we also took full advantage of the extremely generous NASA graduate fellowship I received for my PhD program. By the time I graduated, we had saved about $240K in liquid assets.
The money we saved, while only a fraction of what we would need for FI, was hugely important in us getting to FI just a handful of years after I graduated.
Code
If you want to get your hands a little dirty and review/modify the python code I used to generate the plots above, see the embedded python interpreter below. You can adjust the inputs to your situation/liking, and hit the Run/Play (sideways triangle) button to generate the plots. To go back to the script to make any changes, hit the Pencil icon. If you want the text larger, hit the hamburger menu button, then scroll to the bottom to see larger font options. In that same menu you can also Full Screen the window, and other actions.
Summary
When you don’t have $0 in the bank, things get a little trickier when computing your time to FI, but overall it’s not too bad. Additionally, we see how powerful reducing your expenses is, beyond just boosting your savings rate – for any absolute amount of money you have, the lower your expenses, the closer you are to FI!
I think the impact of your initial net worth is often overlooked in articles about savings rate and FI. Starting with zero net worth vs having some money already saved up when you start seriously pursuing FI has a tremendous effect on your time to FI.
Why? The most intuitive answer: it takes significant energy in the beginning to build up the wealth snowballing effect. You’ll see relatively small incremental gains in your portfolio early on as you start out building your savings. But as time goes on, those gains will start growing like crazy, and eventually your investment returns can easily outgrow your paycheck!
Thus I strongly encourage you to start your nest egg as early in life as possible, even though your income is likely much lower than later in life. Even small amounts of money saved early on can make a big difference on the total time it takes to get to Financial Independence.
* Side note: one of the first “Time to FI” calculators I found online was the awesome Networthify calculator referenced by Mr. Money Mustache. After I found that calculator, I wanted to see if they posted the math behind it, and that quickly to this nice blog post. However, when I implemented the final equation on that post, the results did not align with the values from the calculator. Fortunately Joel from FI180 piped up in the comments to give a different equation, and that led me to flesh out the derivation myself in the provided PDF. Thanks Joel! I then verified the Networthify calculator does provide the correct values, so I suspect they fixed the math under the hood of the calculator and just didn’t get around to updating the blog post.
Gorgeous equations!!!!!! Rob